Follow me on Twitter!


Showing posts with label 2015 Open. Show all posts

Wednesday, April 15, 2015

A Look Back at the 2015 Open: Part II

Welcome back to Part II of the 2015 Open Recap.  Sorry for the delay, but we have a lot to get to this year.  The introduction of the scaled division has added a whole extra layer of complexity, but I think there's some interesting things to be learned, so let's get to it.

First of all, thanks so much to Sam Swift for pulling the data for 2015 (as well as 2012-2014, which I have used to a lesser extent in this post).  He also has some cool analysis on his page, and I suggest you check it out at some point.

For each portion of this analysis, I had to decide whether to include scaled competitors or not. Often, I excluded anyone who scaled any workout, so as to be more comparable to what was done in the past (when scaling was not an option). For instance, with the correlation between workouts, it did not make sense to include scaled competitors at all, as this mixed in scaled and Rx'd workouts and made for an apples-and-oranges comparison. Other times, however, I did include athletes who may have scaled some workouts. For instance, on the 15.2 vs. 14.2 comparison, I included all athletes who did 15.2 Rx'd, regardless of whether they did other workouts scaled. I'll try to note which population was used in each section.

So now for the results.  I'll start with the correlation analysis that I've done many times in the past.  This basically tells us which workouts were highly correlated with success across the board in that season. The charts below show the correlations for women from 2012-2015 (the mens' results are quite similar).


We see first of all that 15.2 was a pretty solid workout.  Interestingly, it had a higher correlation this year than 14.2 did last year. You can see the same pattern between 12.4 and 13.3.  My guess is this is due to returning athletes having a better feel for this workout, and since returning athletes typically do better in general, we see higher correlations.

What is very intriguing is the fact that 15.1a, the max clean-and-jerk, had a relatively low correlation for the entire field, but a relatively high correlation when we limit to the top 1,000 overall finishers. This would indicate that for the top athletes, the best-of-the-best perform quite well in a max clean-and-jerk. But for the entire field, this event didn't pick out the top athletes as well as the other events.

The scatter plots below, which include an evenly distributed sample of the entire field, illustrate the correlation between event success and overall success for 15.1a, 15.2 and 15.3.


It's clear from the plots above that 15.2 is much more strongly correlated with success across all events than 15.1a or 15.3, but what you can also see is that the outliers in 15.3 and 15.1a are quite different.  On 15.1a, note all the dots in the top right - these are athletes who did very well on 15.1a but generally fared poorly on the rest of the workouts.  Conversely, on 15.3, note all the dots on the bottom right - these are athletes who did poorly on 15.3 but generally fared well on the rest of the workouts.

One way I've quantified this effect is to look at what I call positive outliers and negative outliers. Positive outliers are the type we saw on 15.1a (in the top left of the graph) and negative outliers are the type we saw on 15.3 (in the bottom left of the graph). In addition to looking at correlations, this metric can help us assess the type of fitness that this is.  Does this event expose a weakness (such as muscle-ups in 15.3), or does this event really allow certain athletes to shine (such as the max lift in 15.1a)?

Currently the way I'm defining a positive outlier is an athlete who finished in the top 20% of a particular workout worldwide but finished below the 50th percentile on average across the other workouts. A negative outlier is the reverse of this (bottom 20% on the workout and averaged above 50th percentile on the rest).  The chart below shows the number and percentage of outliers on each workout in 2015.  As with the correlations, this is limited to athletes who completed all 5 workouts in the Rx division.  In this case, I've shown both men's and women's outliers.


For both men and women, 15.1a had by far the most positive outliers.  Conversely, 15.3 had the most negative outliers, likely because the muscle-ups proved to be the Achilles' Heel for many an athlete. At some point soon, I'd like to go back and look at this metric for 2012-2015 to see which other events were had a large percentage of negative or positive outliers.

Now let's move on and look at a comparison of the lone repeat workout this year: 15.2.  The two charts below show the distribution of Rx scores for women in each year.  The first chart includes all athletes who completed all five events in either year, while the second chart is limited to athletes who completed all five events in both years, i.e. returning athletes.  The x-axis represents the length of time the athlete survived in the workout rather than the actual score.


Unlike what we saw in repeat workouts in 2014 and 2013, the 15.2 scores were actually better than the 14.2 scores even before limiting to just the returning athletes (you can see this by the red line being skewed to the right, with a higher % of the field surviving late into the workout).  But when we limit this to returning athletes, the disparity becomes even greater.  Nearly 70% of returning athletes got past the 3-minute mark in 15.2, compared with only about 50% in 14.2  About 35% made it past the 6-minute mark in 15.2, compared with about 20% in 14.2. Clearly, the athletes who return each year are improving.

We've focused mainly on the Rx division so far, but what impact did the scaled division have this year? Before the season, many of us figured that the addition of the scaled division played a role in the workouts that were programmed in the Rx division this year.  The charts below would seem to indicate that HQ had no choice but to add a scaled division if they wanted to program workouts like 15.3 and 15.4. The charts both show the total field at each stage of competition, split between scaled (red) and Rx (blue). The numbers represented by those bars are actually taken straight from Sam Swift's site.  But the kicker is the line on the graph, which shows what the Rx field would look like if there was no scaled division, i.e. like 2011-2014. That line represents the competitors at each stage that were "fully Rx," meaning they had not scaled at all by that point. Notice the enormous drop-off in 15.3, particularly for the women. Only about 10,000 women would have been left as of 15.5, which is fewer women than were left at the end of competition in 2013.


One thing to note is that the scoring system allowed the scaled competitors to mix in with the Rx competitors, so that some athletes who scaled a workout or two actually finished ahead of some athletes who went Rx the entire time.  If that was not allowed, the average fully Rx women's competitor would have improved their percentile ranking by 12% and the average fully Rx men's competitor would have improved their percentile ranking by 3%.  I personally don't mind the system in place now, as it incentivizes athletes to use the scaled workouts when appropriate without having to be separate from the main field.  But I'd be curious on the thoughts of others.

That wraps it up for today.  To be sure, there is more analysis to be done on the 2015 Open data, but it's time to move onto Regionals for now.  Stay tuned for a regional preview podcast in the next few weeks, as well as Regional predictions on the site as we close in on the first competitions on May 15.


Wednesday, April 8, 2015

A Look Back at the 2015 Open: Part I

We've all had time to recover from the Open, and for a (very) select few of us, it's time to move onto the regionals.  But at CFG Analysis, we're not quite finished with the Open quite yet.  On the contrary, it's time to take a thorough look back at the 2015 Open, see what the data tells us and start to understand what could be coming in the future.

Like the past two years, I'll be breaking this post up into two parts.  Today in Part I, I'll tackle the programming of this year's Open and how it compared to prior years (and what we may have expected).  Later this week in part II, I'll dig into the leaderboard a bit more to see what we can find.  If you want, see my posts (Part I and Part II) from last year for a feel for what we'll be getting into.

OK, let's get started.  Unless noted, all the metrics in this post relate to the Rx division only.

As I got started on the analysis for this post, my gut feeling was that this year's Open was a whole lot different than the past four years.  Indeed, looking at the Rx division, many of the metrics that I use to evaluate CrossFit programming were quite a bit different than in the past.  But as I looked a little closer, I found that there were really just a few key changes this year.  The biggest, in my opinion, was this:

The Open included a max-effort lift.

If you remove 15.1a (1RM clean and jerk), you're left with programming that is actually pretty similar to what we've seen before.  The chart below shows the men's loading metrics* for 2011-2015, including a version of 2015 that does not include 15.1a.  Note that without 15.1a, things look eerily similar to every other year.  With 15.1a, however, this year definitely put a larger emphasis on heavy lifting and (likely) favored larger athletes more than in the past**.


The loading metrics, of course, don't tell the whole story.  To me, there were three other key differences from prior years:
  1. Handstand push-ups appeared for the first time;
  2. The high-skill gymnastics movements (muscle-ups, handstand push-ups) appeared at the start of a workout, forcing a large portion of the field to scale;
  3. Burpees and box jumps, which accounted for about 20% of the points in the Open in previous years, did not appear at all.
Certainly #2 bothered a lot of people, but for the athletes competing for spots at regionals, this really had no effect on them.  The other two items are somewhat important, and #3 in particular was a shock to me.  As I noted on Twitter a few weeks ago, the 2015 Open was the first time since 2007 that the Open, Regionals or Games did not include burpees (excluding 2010 Regionals, when the workouts varied by region).  The chart below shows the value of each movement in the Open from 2011-2015 (including 15.1a).


Besides the big goose-eggs for burpees and box jumps, note the significance of the clean.  Since being a major player in 2011, the clean had not accounted for more than 5% of the points in an Open until this year.  The inclusion of 15.1a not only made this year a "heavier" Open, but it contributed to the Olympic-style lifts playing a huge role in the standings.  The chart below shows that the Olympic lifts and high-skill gymnastics were valued more than ever in 2015, while basic gymnastics were significantly diminished.


Although this year did include the first max-effort lift in an Open, none of the rest of the events were particularly unusual in terms of load, duration or movements.  The chart below shows the time domain (x-axis), number of movements (y-axis) and LBEL (size of ball) for each Open workout 2011-2015***.  You'll see that besides 15.1a (which I considered a 0-time domain workout despite technically lasting 6 minutes), the workouts were relatively standard compared to past Opens, though a bit on the shorter side.


It is worth noting that the 185/125 clean in 15.4 was the heaviest relative weight (1.37/0.93) ever required in an Open. That being said, I feel that the 165/110 squat clean and jerk (1.23/0.82) in 11.3 was more challenging for the community at that time than the 185-lb. clean was this year.

So where is the Open headed?  Certainly things could change in the next 10 months if there are other changes to the format (multiple scaled divisions, for instance), but it seems that the Rx division of the Open is starting to look like Regionals-lite.  I don't anticipate that the loads will get to Regional levels - the average load in metcons this year was 0.87/0.59, whereas regionals have been averaging 1.12/0.75 in the past.  However, the variety of workouts in the Open seems to be mirroring the Regionals.  I think we could see one or two of these two-part workouts each year, and I'd bet we'll have a max-effort lift each season.

I think we'll continue to see the scaled division evolve (some of the workouts were a little bland this year, in my opinion), but I think the the loads will stay similar to what we had this year, where they were about 70% of what was required for the Rx division.  Now that the community has seen the challenges in the Rx division, I'd expect more athletes to be prepared to scale early and often in the future.  There's no shame in scaling, that's for sure.

That will wrap it up for Part I of my 2015 Open recap.  Stay tuned for Part II later on this week!

*For more background on these metrics, see this post from back in 2012.

**This is something I plan to look into at some point, possibly in Part II.

***For the time-varying and load-varying workouts (including 15.1a), I took the average of the top 1,000 overall finishers from each particular year.  For instance, the top 1,000 overall male finishers took an average of 15.8 minutes on 15.2.  I also considered 15.1a and 11.3 to be single-movement workouts, despite including a clean and jerk.

Monday, April 6, 2015

Podcast Episode 7: 2015 Open Recap

Enjoy the podcast below as Anders and John wrap up this year's Open.  Stay tuned for the full, two-part blog post recapping the Open later this week.  As of now, you can expect Part I on Wednesday and Part II on Saturday.


Tuesday, March 24, 2015

Fun With SWAGs: What Will 15.5 Be?

As I mentioned on Twitter last Friday, there will be no podcast this week.  I'm out of town, but for good reason: I'm attending the SOA's Fellowship Admissions Course, which means I'll basically be "graduating" after years of taking actuarial exams.  I'll be coming home with a few new letters after my name, which is pretty cool.

So no podcast, but that means you get more actual, written words from me - just like in ye olden days, back before I was podcasting and tweeting and listening to all that hippety-hop. Before we get to the SWAG, here's a collection of thoughts about 15.4 and the Open so far:

  • If it wasn't already clear, it should be clear now that HQ does not intend the Rx division to be for the masses.  They want the everyday CrossFitter to use that scaled division and aspire to make it to the Rx division.  I think by next year, people will come into the Open with this mindset, but I'm sure it was difficult for a lot of folks to accept that they'll need to scale workouts this year.  But it's just about modifying your perspective, in my opinion.  The Open was always too heavy, too hard, too skilled for a lot of CrossFitters.  Now they've just made the Rx division an even higher bar to attain, but they've left the scaled division there for the masses.  The scaled division is now even more inclusive than the older Opens, so my guess is that in the future, more and more people will scale, and we'll see the Rx division be a smaller subset of the total field than it is now.
  • I liked the movement choices for 15.4 (although they went against my SWAG, of course), but Occam's Razor would say "What the hell are you doing with that rep scheme?"  Would anyone have complained if it was 3-3-6-6-9-9-...?  In that case, the heavy cleans would have played more of a role, and in my opinion, that would have been a well-balanced workout.  The way it was written, it was not only confusing, but also seemed quite biased toward the handstand push-ups.  I just don't get this one.
  • Rich Froning is going to have a hell of a hard time sitting out of the individual competition this year.  The man can't even let Matt Fraser just have the Open title.  Just watch: Rich will win the final workout, and he will do triple Grace at 315 afterwards and post it on Instagram, just to let you know that he still could win the Games if he wanted to.  And Matt Fraser will come in 2nd on the final workout, and he will win the Open, and it will still be damn impressive.
  • How did Annie Thorisdottir sneak back up into 2nd place on the women's side?  Top 11 on the past three workouts?  Looking at the leaderboard right now, I think it's safe to say the women's side is going to be crazy-competitive at the Games this year.
Enough about the past, let's move on to 15.5.  The Rx division of the Open this year is shaping up to be the heaviest (based on LBEL and average relative load) of all-time, by far.  It's actually on par, right now, with what we typically see at Regionals.  Normally I'd say this implies we'll get something lighter in 15.5, but I doubt that's the case this year.  We've seen a progression so far in 2015 of the workouts getting more and more challenging each week, and I think that continues in 15.5.  I also think this workout will be for-time, and I think they'll make use of most of the movements that have showed up in the past but not this year (burpee, thruster, box jump, row, push-up).

With that in mind, I am going to defer to my wife, who came up with this pick last night.  It has everything I was planning to throw in, and if it ain't broke, why fix it?

3 rounds for time of row 500 meters, 21 burpee-box jumps (24"/20"), 12 thrusters (135/95)

As always, post SWAGs to comments, and enjoy the final workout (or workouts?) of the 2015 Open!

Thursday, March 19, 2015

One Chart: Scaling vs. Rx So Far in the Open

This one will be super-quick today, because I don't yet have the data and/or time to fully do this topic justice.  Expect to see more on this in the Open recap posts in a month or so.

At the request of a couple people, I want to give a quick snapshot of how many athletes are scaling the Open and how many are going Rx.  The trouble for me right now is that I don't have a downloaded version of the full leaderboard, so it's challenging to tell how many athletes have gone Rx in all the workouts.  Athletes can scale one workout and go Rx on another, meaning the leaderboard is a mish-mash of both types of athletes, and the online version is not sortable in a way that I can get at this.

However, what I can do is look at how many athletes are scaling each workout.  The suspicion among many is that far more athletes would be forced to scale 15.3 as compared to 15.1 or 15.2, and the numbers seem to bear that out.  For simplicity, I looked at the Central East region, which should be a pretty representative sample of the worldwide field (again, I'll do this more properly once I have all the data downloaded).  The chart below shows the entire field in each workout, split into Rx and scaled athletes.


It's pretty clear from the two bars on the far right that a lot higher percentage of the athletes had to scale on 15.3 as compared to the first two workouts, particularly among females.  A mere 14% of women managed to complete 15.3 Rx'd, compared to 56% and 66% in 15.1 and 15.2 respectively.For men, 61% completed 15.3 Rx'd, compared to 83% and 84% in 15.1 and 15.2 respectively. 

However, I think it is interesting that from week to week, the total field shrunk by about the same margin from 15.1 to 15.2 and from 15.2 to 15.3 (all between 11%-13%).  Some may have expected that a lot more athletes would drop out entirely during 15.3 due to having to scale, but it doesn't appear that was really the case.  These rates of attrition are very similar to what has been observed in the past few years.  What will be interesting is how this changes moving forward: will athletes be more willing to scale after scaling 15.3, or will they eagerly jump back into the workouts Rx'd if possible?  For women, there were actually slightly more Rx women in 15.2 compared to 15.1, so I imagine it's likely that many athletes will hop right back into the Rx field this week.


Note: I'm always looking for help pulling in the entire dataset.  Several people have helped or volunteered their help in the past, so please contact me at anders@alumni.wfu.edu if you think you'll be able to help me out.   Any help is much appreciated, and thanks again to all those who have helped me in the past.

Tuesday, March 17, 2015

Fun With SWAGs: What Will 15.4 Be?

Last week's SWAG was another half-way decent one that at least got the time domain close (15 minutes vs. 14 minutes) and got one movement right (wall balls), but it wasn't exactly spot-on.  I certainly didn't predict that muscle-ups would appear first in 15.3, but as you'll hear on the podcast below, this wasn't something that came completely out of nowhere.

This week I double-down on an earlier pick, because it just seems too good to pass up this week, but I promise I won't make this pick again if it fails me again.  I've got to believe this week will be short, intense, and I don't think we're quite ready to repeat any movements that have shown up yet.  With that in mind, the official CFG Analysis SWAG for 15.3 (Rx'd division) is:

AMRAP 7 of burpee-box jumps (30"/24")

Remember to check out the podcast for as John Nail and I discuss 15.3, the controversy surrounding muscle-ups appearing as the first movement in an Open workout, how annoyingly hard single-unders can be, and of course, our picks for 15.4.

Please post SWAGs to comment.  Even with so many movements off the table, it will still be quite the accomplishment to get 15.4 or 15.5, especially with HQ showing that the game has changed this year.

Also, be on the lookout this week for a short post later this week looking into how the effect of the 15.3 muscle-ups on the number of Rx vs. scaled athletes, and how it compares to past Open workouts in terms of thinning out the field.


Tuesday, March 10, 2015

Fun With SWAGs: What Will 15.3 Be?

Well I would have liked to pat myself on the back for having a relatively decent pick last week (it was a repeat, and it did include overhead squats), but since two of our readers got 15.2 exactly right, I guess I'm not so smart after all.  Congrats again to JesseM (via comments section) and Kelcey Lehrich (via Twitter) for calling 15.2.

But enough about those guys.  This is my week for glory.  The Open really hasn't brought the pain yet, and I think this is the week HQ puts a beatdown on the community.  Among Rx athletes, only about 14% of males and about 5% of females made it beyond the round of 14s this year*, so that means the vast majority of the field hasn't had a metcon that lasted longer than 9 minutes yet.  And I think the first two metcons have been more about strategy and avoiding muscle fatigue, and less about engine.  I think that changes this week.

The official CFG Analysis SWAG for 15.3 (Rx'd division) is:

AMRAP 15 of 15 row calories, 30 wall balls (20-lb. to 10'/14-lb. to 9')

Remember to check out the podcast for chatter with John Nail about 15.2 and more details about why our predictions for 15.3 are bound to come true.  Plus we've got a short interview with soothsayer Kelcey Lehrich, he of the correct 15.2 prediction.

Please post SWAGs to comment.  With another repeat workout (likely) off the table, a correct pick this week will be a true accomplishment (still no beer on the line, but perhaps we can work something else out).


*Last year, those percentages were 10% for men and 3% for women.  So it appears the community is improving, although some of that could be influenced by athletes shifting to the scaled division this year.  We'll look more into how continuing athletes improved in my Open review in a month or so.

Tuesday, March 3, 2015

Fun with SWAGs: What Will 15.2 Be?

So we weren't exactly close last week.  I got almost no elements correct about 15.1 (including the fact that it was actually two workouts), although I will give myself a big pat on the back for correctly guessing that it would not be a repeat.  That was brilliant on my part.

Anyway, that's not going to stop me from making a bold pick about 15.2 (it certainly never has in the past).  For all the gory details about how I came up with this pick (along with all the latest on Kim Jong Un's brief stay at the top of the Open leaderboard and other 15.1-related chatter), listen to the podcast below or download it on iTunes.

The official CFG Analysis SWAG for 15.2 (Rx'd division) is:

AMRAP 10 of 60 bar-facing burpees, 30 overhead squats (120/90), 10 muscle-ups (i.e. repeat of Open 11.4)
[Update 3/5 - Fixed the women's weights on this workout to match 2011 exactly.  Thanks to kentyman for the catch.]

Please post SWAGs to comment so that you'll be able to gloat later in the event that your guess is actually not way off.  No beer on the line this week, unfortunately.

[Update 3/6 - Congratulations to JesseM (via comments section) and Kelcey Lehrich (via Twitter) for successfully predicting 15.2!  And thank goodness I did not promise beer this week...]

Monday, March 2, 2015

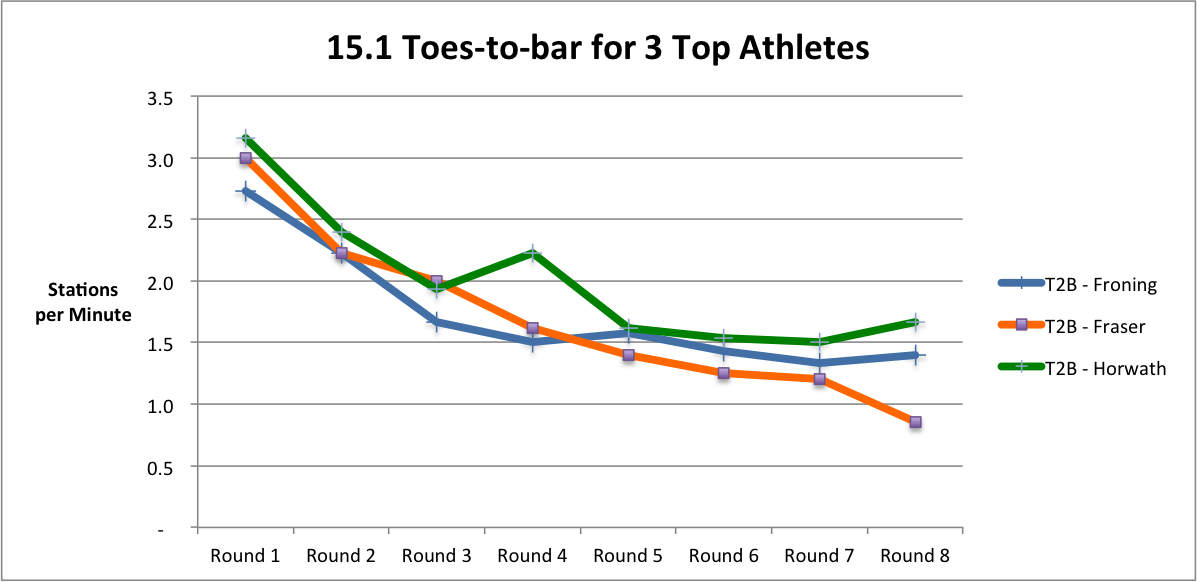
Froning vs. Fraser (vs. Horwath) in 3 Charts

I'll have plenty more thoughts on 15.1 (and 15.1a) on the podcast tomorrow, and I may even go a little more in depth on the blog later this week as well, but I want to keep things short today.  My preliminary analysis (and my intuition) is saying that this was a toes-to-bar workout, but that's not to say that was the only element that mattered at all.  The snatch was also critical, and as we'll see below, transition time on the deadlift actually could be the difference between scores among elite athletes.

Consider three athletes: Rich Froning, Matt Fraser and Brian Horwath.  Brian Horwath?  Yes, Brian Horwath.  As of 6 p.m. ET, he had the highest score on a video submission in 15.1 (229), and he attacked this workout completely differently than Froning (224) and Fraser (219).  Horwath clearly didn't have the barbell strength that Froning and Fraser did, as evidenced by his 255-lb. clean and jerk in 15.1a (still quite respectable, don't get me wrong).  In fact, he did singles on his snatches throughout the workout, but he made up for this with blistering speed everywhere else.

The three charts below show the pace of each athlete on each movement throughout the workout.  Note a few things:
  • The toes-to-bar degrade for all athletes here.  There are few movements in CrossFit where this is as consistent as in the toes-to-bar.  We saw it a few years ago in 13.4, and I see very few, if any, athletes who can consistently bang out sets of 10+ for a workout longer than 5 minutes.
  • Horwath only goes a little faster than Froning and Fraser on the toes-to-bar, but he maintains that lead throughout.  That small advantage was a big factor.
  • Froning and particularly Fraser were much faster on the snatch.  In the 10 or so videos I've watched, no one has come close to matching Fraser's speed on the snatch.  In hindsight, maybe this was not the best strategy.
  • Horwath blazed on the deadlift.  Absolutely no rest whatsoever after getting off the pull-up bar.  That saved him about 4-5 seconds per round on Fraser and Froning.

Remember, there are many ways to win a workout, and in the Open more than any other time, strategy matters.

[Update 3/7/2015 below]
I know we've all moved on to 15.2, but I finally was able to complete a reasonable analysis of how much each movement was valued on 15.1.  I'll skip the deep background on this and instead refer you to this post and this post.  Below are the results, based on a review of 9 elite-level male athletes (all scored at least 190 on 15.1 and hit at least 290 on 15.1a.)

The interpretation of this is that if an athlete goes 1 standard deviation slower than average on the toes-to-bar and 0.5 standard deviations faster than average on the other two movements, that athlete's score will be 7.4% worse than an athlete who is average on all three movements.  In the deadlift column, this represents a scenario where the athlete is slower on deadlifts but a little faster on the other two movements.  In the snatch column, this represents a scenario where the athlete is slower on snatches but a little faster on the other two movements.  

What this is telling us is that athletes are punished most for a weakness on the toes-to-bar, followed by snatch, followed by deadlift.  The spread here is pretty wide, and the deadlift showing a negative-3.7% leveraging is pretty amazing.  If you're not very speedy on the deadlifts, it was not hard to make up for that on the other two movements.  Conversely, if you struggle with toes-to-bar, you are in big trouble.  

From the feedback I've received and seen online, this lines up very much with what people feel intuitively about the workout.  The 7.4% leveraging (at 1 standard deviation) is actually slightly lower than the 7.8% leveraging I observed on 14.1 last year, but we all know that 14.1 was all about the snatch.  And if we compare to what I saw when I looked at Jackie at the 2013 Regionals, the toes-to-bar in 15.1 was far more leveraged than any of those movements (in the original post I adjusted each movement by 2 standard deviations, but when I adjusted that to be 1 standard deviation, the highest leverage on any movement was the pull-ups for women at 2.2%).

Note that this type of analysis is quite time-consuming, so I don't do it that often.  If split times became more easily obtainable, I'd like to do this on a more regular basis, as I find it quite fascinating and potentially useful for athletes.

Tuesday, February 17, 2015

Fun with SWAGs: What Will 15.1 Be?

It's officially 2015 Open season, everyone, and that means one thing: making highly unlikely yet completely overconfident predictions about what the workouts will be.  This year we'll be unveiling the SWAG each week on the site, but the explanation of my thought process will be in the podcast for those who are interested (which should be all of you!).  My buddy and frequent commenter John Nail will join me each week on the podcast as we break down the prior week's workout and look ahead to what might be to come.

So without further ado, the official CFG Analysis SWAG for 15.1 (Rx'd division) is:

AMRAP 7 of burpee-box jumps (30"/24")

I encourage everyone to post your SWAGs to comments, since odds are you'll do better than me.

[NOTE 2/19/2015: I re-uploaded the podcast last night with the tracks mixed more evenly, so hopefully this fixes the issue that some listeners had with the original.]

Saturday, February 7, 2015

CFG Analysis Podcast - Episode 2 - Open Preview

In today's episode of the CFG Analysis Podcast, I'm joined by fellow CrossFit athlete John Nail to discuss what might be coming up in the 2015 Open.  John and I have worked out together for years and have gone HAM on many a WOD in that time.  John is best known on the site here for his excellent (though generally incorrect) SWAG's during the Open season.

The Pilot Podcast and all future episodes can be found at http://cfganalysis.libsyn.com  or on iTunes.  I'll likely continue to post each new episode of the podcast directly on this site as well.

Also, as you may have noticed below, I'm not so great when it comes to creating artwork on a computer.  If anyone out there is so inclined to create a better image for the podcast, feel free to shoot it my way.  1,400x1,400 in .jpg format, please.

Sunday, January 4, 2015

How Many Years Do CrossFit Athletes Last in the Open?

What you need to know from this post:
  • About 50% of athletes who compete in the Open on year will continue to the following season.
  • Athletes who have competed for multiple years have a higher likelihood of returning the next season than athletes who are competing in their first season.
  • Based on data from the past four years, approximately 20% of athletes who start competing in the Open will still be competing in their fourth season. I estimate that approximately 10% will still be competing in their seventh season.
  • The higher an athlete ranks in the Open, the higher the probability that they will return the next season.
As I mentioned a few weeks ago, I will be missing the Open for the first time this season.  I had arthroscopic hip surgery to repair a torn labrum.  Without getting into too much detail, the injury was a chronic wear-and-tear type of injury that wasn't a direct result of CrossFit, per se, but rather the fact that I had been so active for the past 10-15 years.  I had a hip impingement that I was born with that put me at risk for this type of injury.  I hope to return to CrossFit eventually, but I won't be ready to compete by late February.

So although my injury isn't directly attributable to CrossFit, it's forced me to face the fact that competing and training at the level I had been is not always easy to sustain.  For me, it was my hip.  For others, it is a shoulder or a knee.  This is true in any sport, and CrossFit is not immune.  This is not a commentary on whether CrossFit as a training methodology is dangerous.  That's a third rail I don't intend to touch.  My point is simply that injuries are inevitable when competing in any serious sport.

With an assist from my wife, who came up with the idea for this post, I decided to try to answer the the question: how long do CrossFit athletes tend to compete?  I'm not talking just about the Rich Fronings of the world, but the everyday athlete who signs up for the Open with no hope of even sniffing Regionals.  We see the Open growing in size each year, but that doesn't necessarily mean athletes are continuing on for multiple years; we could just be replacing the vast majority of athletes one year with an even bigger crop of newbies.

Of course there are multiple reasons an athlete won't compete: injury, lack of interest, disappointment from poor performance in a previous season, work commitments, etc.  With the data I have available, I can't identify which factors are most important, but I can get a pretty good idea of the rate at which athletes are dropping off.

Using the Open data from 2011-2014, I looked at how many athletes continued on each year and what attributes about the athlete (prior Open experience, prior Open finish, age, weight, height) may have an influence on their likelihood to continue.  Because I only have athlete names without any other identifier, this analysis is limited to "truly unique names," which are those that never appeared more than once in any year.  I also focused my analysis on men, because women's names are frequently changed due to marriage or divorce, making it hard to track which athletes truly dropped out and which simply changed name.*

The way I am defining it, an athlete successfully survives from one year to the next if he completes all the Open events in both years.  Failing to complete all the Open events in a given year is counted the same as not competing.  Keep that in mind, since typically about 30% of the Open field from week 1 is gone by the end of the Open.  For purposes of this analysis, those athletes never even competed.  I don't care that HQ still got their money.

Finally, in this study, once you're out, you're out.  If an athlete skips a year, I ignore whether or not they returned the following year.  This makes things much cleaner for the analysis.  In case you are wondering, only about 15% of athletes skip a year and return in a subsequent year (I hope to be one of those 15%!).

OK, so let's get to the results.  First, the simplest way to look at this is to evaluate the athletes that started in 2011 and see how many were left in each subsequent year.  Let's take a look at those results below.


You can see that nearly 60% of athletes survived to Year 2 and nearly 30% were after Year 4.  The issue with this analysis is that it ignores the athletes who started after 2011, which is a huge chunk of the current athlete pool.  The type of athlete who is competing today may be characteristically different than those who started in 2011, and we want to capture that.

The next chart estimates a survival curve for today's athlete population using only the most recent information.  To get the survival rate from Year 1 to Year 2, I looked at athletes who first competed in 2013 and see how many returned in 2014.  To get the survival rate from Year 2 to Year 3, I looked at athletes who competed in 2012 and 2013, then found out how many of those returned in 2014.  To get the survival rate from Year 3 to Year 4, I looked at athletes who competed in 2011-2013, then found out how many of those returned in 2014.

To get the cumulative survival rate for year 3, I multiplied the survival rates for years 1-2 and years 2-3.  To get the cumulative survival rate for year 4, I multiplied the survival rates for years 1-2, years 2-3 and years 3-4.  I then took it one step further, estimating survival rates in years 5-7 based on the rates for the first 4 years.  These are obviously estimates, as we don't have enough data to know the true likelihoods beyond year 4.


Here we see the survival rates are much lower than we previously observed.  About 50% of athletes remain after year 2, about 20% are left after year 4 and I'm estimating only about 10% will be left after year 7.  Clearly the majority of athletes don't make it too many years in this sport, but there is still a decent chunk of the population that sticks with it for years.

However, what's not obvious in the chart is that the chances that an athlete continues in the following year increases with each subsequent year of participation.  Below are the year-to-year survival rates:
  • Year 1-2: 47%
  • Year 2-3: 61%
  • Year 3-4: 72%
This is good news in my opinion.  We see that athletes who stick with it beyond the initial year are not likely to "burn out" the longer they compete.  Once an athlete is sufficiently invested, they are pretty likely to keep at it.**

In total, when you combine first-, second- and third-year competitors, about 52% of the field returns in the following season.  One offshoot of this is that if we consider how fast the Open has been expanding, we know that it must be largely made up of first-time competitors.  In order to maintain the size of the Open field from one year to the next, we need a lot of new athletes each season.  If there were 200,000 total athletes last season, we likely need about 100,000 new athletes to enter the field in 2015 simply to maintain the same size field as before.

The last piece of this analysis was to try to identify other factors (aside from number of years of prior experience) that made certain athletes more or less likely to continue in subsequent years.  For this, I limited the data again to only 2013 and 2014, then further limited the data to athletes who submitted a height and weight (I used the 2013 height/weight for all athletes).

Using a logistic regression model, I looked to see if 2013 percentile rank, age, height or weight had statistically significant impact on the likelihood of returning in 2014.  As it turned out, all but height had a statistically significant impact (p-value less than .01 for percentile rank, age and weight).  However, in my opinion, we can basically ignore weight because the predicted probability of returning did not vary a whole lot (only about 4% higher probability at 180 lbs. vs. 220 lbs.).  

The big key was the 2013 percentile rank.  As you might expect, athletes who finished near the top of the rankings had a much higher likelihood of returning.  Holding all other items at their mean, the predicted probability of returning was 74% for an athlete finishing in the 1st percentile, compared with 55% at the 50th percentile and 35% at the 99th percentile***.  If you aren't convinced by those somewhat opaque predictions from the logistic regression, the chart below shows the observed percentage of athletes who returned, by 2013 percentile rank.


As you can see, the pattern is very evident.  I'm not sure this will come as a surprise to anyone, but it's always nice to see your intuition confirmed in the data.

Age was an interesting factor.  There are two things going on here:
  1. Without controlling for the 2013 percentile rank, it appeared that age had basically no effect.  
  2. Older athletes tend to have worse rankings than younger athletes in general. As we just showed, athletes with lower rankings have lower persistency.
What happens here is that the logistic regression showed that all other things being equal, older athletes actually have a higher likelihood of returning than younger athletes. If we hold the other items at their mean, the predicted probability of returning was 51% for a 20-year-old and 65% for a 50-year-old.

Of course, the big question moving forward is how things will change with the changes made to the Open in 2015.  The addition of a scaled division is likely to siphon off some athletes who had previously competed in the Rx'd division, and it's possible that with only 20 Regional invitations in each region (as compared to 48 in 2013-2014 and 60 in 2011-2012), some additional athletes will drop out.  I also have to believe that the overall participation in the Open will not continue to expand the way it has since 2011, where it has roughly doubled each season.

There is no way to know the answers to these questions right now, but understanding what has happened in the past will certainly help us understand the impact of these changes in the future.

[Thanks a lot to Andrew Havko, Michael Girdley and Jeff King for pulling this data for me and/or making it publicly available]

*It appears that overall, the survival rate for women is very similar to that of men.  Initially, it appears about 4% lower, but using some very rough data for the marriage and divorce rates, that discrepancy could very easily be attributable entirely to name changes.

**For my estimates beyond year 4, I assumed this would continue to flatten out, so I used 77% for year 4-5, 79% for year 5-6 and 81% for year 6-7.

***These predicted probabilities are all probably about 4% too high.  That's because the subset of athletes used for the logistic regression was limited to those that submitted a legitimate height and weight.  In general, these athletes have slightly higher finishes and are slightly more likely to return than the average athlete.

Monday, November 24, 2014

What to Expect from the 2015 Open

So I'm a little late on my annual "What to Expect" post this year, but you've still got about 3 months left before 15.1 is announced.  That means there's still plenty of time to fine-tune your game, work on your weaknesses and get yourself as prepared as possible for this year's Open.  To help you do that, this post gives you an overview of the type of programming you should expect to face.

For those familiar with my past "What to Expect" posts, nothing here should come as a major shock to you.  But I have updated the numbers based on what happened last year, and I've also got some thoughts on what might change this year due to the changes mentioned by Dave Castro following the CrossFit Invitational a few weeks ago.  For those of you who are new, this should be a good primer on what the first stage of the CrossFit Games competition is all about.  To be sure, it is quite different from what you may have seen on ESPN (hint: you probably won't be pushing any sleds or doing 315-lb. squat cleans for time).

The way this post will be laid out is the same as last year.  I'll pose some questions that many newbies might have, and I'll answer them as best I can based on the information we have from the 2011-2014 Opens.  As I have noted in the past, I won't be covering how you might want to train for the Open in this post, but rather what you should be training for.

Let's get started.


What movements will I need to do?

Fantastic question.  I like where your head is at.  Although the CrossFit Games is all about preparing for the "unknown and unknowable" (do they still use that tagline?), you can expect to face a small subset of movements in the Open.  By my count, there have been 52 different movements tested at the CrossFit Games finals, there have only been 15 tested in the Open.  The chart below shows how much value each of these movements has been given in the past four years, along with the best estimate of what might be to come this year.  All of the "best estimates" in this post give more weight to recent years, but they are influenced to some extent by all years dating back to 2011.


Last year's open had a little wider spread of movements than in the past, but still, you can see that historically, there are a few movements that are tested heavily again and again.  This year, you can expect about 60% of the points to come from six movements: snatch, burpee, thruster, pull-up, double-under and box jump.  Just in those six alone, you can see that there is a jumping theme.  All but the pull-up and thruster involve some sort of jump or explosive hip movement (and you could argue the thruster does, too, especially at higher weights).

It's also worth noting (for all you home-gym folks) that you may need a Concept 2 rower available to be able to compete in the Open.  From 2011-2013, nothing was required other than a barbell, weights, rings, a box and a pull-up bar, but in 2014 there was a workout that involved rowing.  This came as a surprise to many, but now that it's been done once, don't be caught off-guard if it happens again.

In the previous chart, there was also a "Subcategory" listed for each lift (I know a wall ball isn't actually KB or DB, but I put it in there because it's a lift that doesn't use a barbell). Grouping movements by the subcategory can be useful, because it reduces some of the noise and gives us an idea of the type of movements that will be used. For instance, cleans haven't actually been used that much in the Open the past three years, but I wouldn't recommend skipping them in training - the movement pattern is similar to that of a snatch, which is highly valued. Below is a table similar to the one above, but looking at subcategories instead of specific movements.


The big theme here has not changed since 2011.  The focus of the Open is on two things: Olympic-style lifts and basic bodyweight gymnastics. This is partly due to equipment restrictions in the Open, but partly due to the fact that HQ seems to really value those two types of movements when making the first cut of athletes.

For those wondering why I have a category for "Uncommon CrossFit Movements" that has 0% value each year, it's because that category contains things like sled pushes, sandbag carries and swimming that have appeared at the Games but are rarely seen at other levels of competition.


How heavy will the lifts be?

Two years ago, I came up with the concept of average relative weights last year as a way to understand this topic a bit better. There is more background in this post from 2013, but here's the concept: depending on the movement, a certain weight may be heavy, medium or light, so I have normalized the weights prescribed on each workout so that we can get a fairer indication of how "heavy" the lift was. After looking at the normalized loads that were prescribed in the past three years, I applied the average relative weight we've seen to the various lifts to show the average expected weights in this year's Open.


The above graph is useful, particularly for new competitors who'd like to get a feel for what they will have to handle in the Open workouts.  However, there are some other factors to consider:
  • These are only averages. The "heaviest" load required in the Open was a 165-lb. clean and jerk (squat clean and jerk technically), which is roughly equivalent to a 130-lb. snatch, a 290-lb. deadlift or a 145-lb. overhead squat. Last year, I said that HQ would likely never require something that heavy again, but with the scaled division being added this year, I actually think it is possible (but unlikely) to see something that heavy required in an Open workout this year.
  • Once in the each of the past three years, HQ has programmed workouts where the weight starts light (to allow everyone to participate) but gets progressively heavier.  Expect this to happen again in 2015.  For those looking to make the Regionals, you'll likely need to be able to comfortably move weights that are about 75% heavier than the loads shown above (for instance, 165-lb. snatch for men).
  • From 2011-2013, HQ never really went heavy on a "heavy" lift (like the deadlift), rather going with heavier loads on the Olympic lifts.  Last year in 13.3 (deadlift/box jump), they showed that you need to have plenty of weights on hand.  Anyone qualifying for Regionals would have needed to handle plenty of deadlifts at 315 for men or 225 for women.
The chart below illustrates the distribution of weights that have been used in the past.  For workouts where the weights got progressively heavier, the weight used for this chart was the average that would be lifted for a typical Regional-level athlete.  Above each bar on the chart, I've given some examples of the type of movement/loading combinations that would fall into that range.


What types of WODs will be programmed? Will there be any ridiculous chippers like 121201?

First of all, there will not be anything like that workout.  There should never be anything like that.  If you are a gym owner, do not program 20 different movements into one workout.  Please.

Anyway, HQ has made it clear that they believe couplets and triplets are the bread-and-butter, so I'm sorry if you're really awesome at "Filthy Fifty," because it's probably not getting programmed.  We did see a little more variety last year with 14.4 and 14.5, but still, it's going to be pretty straightforward.

In the past four years, we've seen 21 workouts:
  • 20 of them included either one, two or three movements.  One involved five movements.
  • All were metcons (no max-effort lifts)
  • 18 had a fixed time limit, and 2 had a time limit that could be extended if you completed a certain amount of work in the first time limit.  Only one has had a required amount of work.
  • All fixed-time workouts have been between 4 and 20 minutes.  Anyone competing at Regionals would have finished the "for time" workout in less than 15 minutes.
Is it impossible that a max-effort workout will be used this year?  No, not after seeing a few of those in the team series.  But I still wouldn't count on it.  Work on your metcons if you want to qualify for regionals.

The chart below helps to get a sense visually of what combinations of loading, duration and number of movements we have seen in the Open.  Each ball represents a workout, and the size of the ball indicates the load-based emphasis on lifting (LBEL) of that workout. The LBEL is a metric that tells us not only how heavy the loads were, but what percentage of the workout was based on lifting. So if the workout had 135-lb. cleans and burpees, the average relative weight is 1.00 but the LBEL is 1.00x50% = 0.50.  The left-right arrows indicate the time domain was variable; the plus-symbol indicates the weight was variable.  In those cases, I've used the average time/load for Regional competitors.


You'll notice that as the workouts get longer, the weights tend to decrease and the number of movements tends to increase. This is also typically what we see in CrossFit programming on the main site and in most gyms. For instance, programming 7 minutes of burpees (Open 12.1) is torturous, but not unreasonable; programming 20 minutes of burpees is a recipe for Rhabdo.


Are past years really a good predictor of what's to come this year?

In many ways, they are.  We have not seen big shifts in the types of movements tested, and the loading has not drastically changed in the past four years of the Open (although it has been declining slowly each year).  There were a couple of curveballs last year with the 5-movement chipper (14.4) and the for-time workout (14.5), but those workouts were still not wildly different than what we had seen in 2011-2013.

That being said, the introduction of the scaled division this year could change things.  It's all speculation at this point, but as I said a few weeks ago, HQ may be more willing to push the required loading up a bit in the Rx division.  I'd also say that we could see some slightly more challenging movements (such as handstand push-ups).  That being said, I doubt that HQ is going to change the over ally feel of the Open dramatically.  The Open is likely still going to be a test of conditioning primarily, with a modest amount of strength required in order to move on.  The big weights will probably come into play more at the Regional level, and the truly unexpected movements and workouts will be reserved for the Games.

I hope that new and old athletes alike can get some value out of this.  As I've said before, I'm not going to tell you how to train, but I'll try to help you understand what you should be training for.


*Note that for this chart, I considered Open 11.1 a single-modality despite technically being a clean and jerk. Also, in calculating the LBEL for the snatch workouts with varying weights, I took the average weight lifted for someone who reached regionals. This reflects the fact that, while only 75 lbs. is required, for a regional-level athlete, they'll be moving somewhere around 130 lbs. on average throughout the workout.

Wednesday, November 12, 2014

Quick Hits: What Impact Will Next Year's Games Season Changes Have?

In a surprise announcement following the conclusion of the 2014 CrossFit Invitational, Dave Castro unveiled some changes to next year's Games season.  The details are still a little sketchy, and it sounds like HQ may be leaving themselves a little wiggle room to change their minds, but on the surface, the changes seem pretty substantial.

There were three key changes that Castro mentioned:

  1. Add a scaled division to the Open
  2. Limit each of the current regions to somewhere around 20 athletes qualifying for the second level of competition (formerly "Regionals")
  3. Regions will then be combined (likely in pairs) to produce "Super-Regionals," each of which will qualify 5 athletes to the Games
First of all, I'll say that like many of the changes HQ has made in the past, I am initially skeptical.  That being said, many of those past controversial decisions (moving the Games from Aromas, partnering with Reebok, replacing in-person sectionals with the Open) have worked out well.  So I won't pass judgment just yet.

But that doesn't mean we can't start trying to assess what the impact will be (without labeling that impact "good" or "bad").  I'll address each of the three changes and what impact I believe they will have next season.


Add a scaled division to the Open
  • The reason has to be money, right?  Not that there's necessarily anything wrong with that.  But HQ is likely seeing that there is an untapped market of athletes looking to compete who may not have quite the capacity to handle the Open.  
  • That being said, I have to believe that market is not huge.  What I would expect is a lot of beginner-level athletes who would otherwise have entered the Open will switch to the scaled division.  I'm not sure there will be a ton of increased participation solely due to this division.  Measuring this will be tricky, to be sure.
  • For the Rx division, my guess is this means the loading could increase a bit, but what is more likely is that HQ will start workouts with heavier loads.  For instance, 14.3 was a heavy workout, but it started very light.  It wasn't until the third round that things even got close to a 1.00 relative weight.  I'd expect that workouts like 11.3 (AMRAP-5 of squat clean thrusters at 165/110) could be fair game again, as well as something like the snatch ladder in the Team Series, which started at 135/95.
  • I don't expect the types of movements tested to change much.  I believe HQ still wants the Open to be a test of conditioning with mostly basic movements.  They will leave the more advanced movements and extremely heavy loads to regionals and the Games.  Maybe we'll see some handstand push-ups thrown in, but I still wouldn't expect rope climbs or dumbbell snatch.

Limit regions to 20 qualifying spots out of the Open
  • Yikes.  The Open will be even more cutthroat this year, and absolutely only the very serious athletes will be contending for spots in the next stage of competition.  
  • My fear is that this further intensifies any potential judging problems.  Athletes are going to be pushing the boundaries on range-of-motion in order to get into that top 20, which means more likelihood of complaints from those who don't approve.  The good news is that HQ requires video for all qualifiers, so the evidence will be out there.
  • Here is the list of 2014 Games-qualifying athletes who would not have made it past the Open last year under this format:
    • Quinton Z Van Rooyen (Africa, 40th)
    • Tyson Takasaki (Canada West, 22nd)
    • Cody Anderson (North West, 45th)
    • Kenneth Leverich (Southern California, 31st)
    • Paul Tremblay, who competed on Team Canada at the Invitational, would have been right on the border in 20th.
    • Interestingly, no females would have missed the cut.  This is likely due to the fact that the women's field still doesn't have quite the depth of the men's field.
  • It will be interesting if this number varies by region.  Will 20 athletes still qualify from Africa? Will only 20 be allowed from the South East, which had nearly 5,900 athletes complete all five workouts last year?

Combine regions to make "Super-Regionals"
  • It seems this was done to address some of the issues that have arisen the past few years with some elite athletes from talent-rich regions missing out on the Games despite posting results that would have won many other regions (Graham Holmberg 2014, Nick Fory 2013, Kristine Andali 2014).  
  • The issue here is combining the right regions.  Sticking Northern California and Southern California together isn't going to make it any easier to get out, and putting South West and Latin America together would still make for a pretty weak Super-Regional.  However, it sounds like HQ wants to combine regions based on geography, so we still may end up with some of the same issues.
  • You could (and probably will) see some of the old regions not have any athletes qualify.  For instance, if Central East and North Central were combined last year, Kyle Kasperbauer would have been the only male North Central representative in the top 6 based on the Cross Regional Comparison (even after my adjustments for the week of competition, this would still be true).  Depending on how they combine the regions, we may not see any athletes from Asia, Africa or Latin America.
  • We will potentially see the loading and skill levels increased even further since the bottom half of each region has been weeded out.  However, I think any changes here will be modest, since HQ likely wants each level of competition to maintain its own identity.  I believe the Regionals are still a test of classic CrossFit movements tested at high loads and short-to-medium time frames.  I think HQ will leave the crazy stuff for the Games.
I'd be interested to hear the thoughts of others on this.  I'm still planning on publishing my "What to Expect from the 2015 Open" post in the next few weeks, but there are certainly a few more unknowns than there have been the past two years.  It should be interesting, if nothing else!