Follow me on Twitter!


Showing posts with label Training/WOD analysis. Show all posts

Wednesday, September 9, 2015

Back from the Dead with More 2015 Games Analysis

In late July, I caught a break at work that allowed me to watch the 2015 CrossFit Games nearly uninterrupted from Friday through Sunday.  I kept up with the CFG Analysis Games Pick 'Em daily and took to Twitter several times a day to converse with others about the action.  It was glorious.

The day after the Games ended, things turned around in a hurry.  Free time evaporated quickly, replaced by weekends and nights working just trying to keep up at work.  In past years, I typically like to post my thorough CrossFit Games recap within a few weeks of the end of the Games, but that just hasn't been possible this year.  But I have been able to chip away at a few different analyses, and I figure now is as good a time as any to post what I've found.  I know many of you have moved onto the Team Series (starting today!), but this post will focus on the individual 2015 Games season.


Katrin Tanja Davidsdottir and Ben Smith Deserved It

As I do most years, I looked at the results from this year's Games under a number of different scoring systems, and Davidsdottir and Smith wound up on top in all of them.  Here are the top 3 under the various systems I tested:
  • Classic Points-per-Place (low score wins)
    • Men - Smith, Fraser, Gudmundsson
    • Women - Davidsdottir, Toomey, Sigmundsdottir
  • 2012-2014 Games Scoring
    • Men - Smith, Fraser, Gudmundsson
    • Women - Davidsdottir, Sigmundsdottir, Briggs
  • Normal Distribution Points-per-Place
    • Men - Smith, Fraser, Gudmundsson
    • Women - Davidsdottir, Briggs, Sigmundsdottir
  • Standard Distribution System (not points-per-place)
    • Men - Smith, Fraser, Gudmundsson
    • Women - Davidsdottir, Briggs, Toomey
The top 3 men are actually identical under every scenario I looked into.  The only system I've seen proposed where Davidsdottir doesn't win is a system in which all the athletes who did not complete any reps on Pedal to the Metal 1 were given 0 points.  However, that's not really a system that makes much sense to me.  A more reasonable alternative for the events with large ties is to give all tied athletes the average ranking from that group, rather than the highest possible ranking.  In this case, that would mean giving Davidsdottir and the other 24 women with no reps a rank of 25th, which translates to 30 points, rather than the 54 they did receive.  This would drop her to 766 points, still above Tia-Clair Toomey's actual total of 750.  Keep in mind Toomey also would have lost 12 points under this system, putting her at 738.


Metcons at the Games Keep Getting Heavier

Since the Open began in 2011, the required weights at the Open and Regionals really haven't changed significantly.  Think about it: how many times have we seen 75-lb. snatches required for men in the Open? (answer: 4)  But at the Games, we've seen a steady trend of heavier and heavier metcons over the years.  In 2011, it would have been unreasonable to have 100-lb. dumbbell snatches required in a metcon.  Even something like Heavy D.T. (205/145) would have been a major stretch.

The chart below shows the average relative weight load at the Open, Regionals and Games since 2007.


The chart above does consider the 2014 Clean Speed Ladder and the 2015 Snatch Speed Ladder to be metcons, which I think is reasonable considering the weights are required and the athletes are expected to move the weights quickly.  If we exclude them, the pattern is generally the same, but it flattens out in 2013-2015.  Note that the levels are still well above pre-2013 levels.


2012 Regionals Still the "Heaviest" HQ Individual Competition Ever

Despite these increases in loading for metcons, the 2015 Games was still only the third "heaviest" competition in history, according to load-based emphasis on lifting (LBEL).  That's because the points for the 2015 Games were only 49% from lifting events, which is only slightly above the historical average.  This year's Games had an LBEL of 0.80, which is above the historical Games average of 0.67 but not an all-time high.  The 2014 Games were 55% lifting and therefore had a somewhat higher LBEL (0.89).  This is the highest all-time for the Games, but not among all HQ competitions.

The 2012 Regionals remain the gold standard as far as lifting-biased competitions.  The points at that competition were 67% from lifting events and the average load in metcons was 1.15, which is on par with the 2011 and 2012 Games and higher than the 2013 and 2015 Regionals.  The LBEL at that competition was a staggering 0.92, more than 34% higher than the historical Regional average (0.69).  It's still a minor miracle that Spealler was able to pull out a qualification spot.


Want to Win the Games?  Better Be Able to Run.

Despite having minimal emphasis at the Open and Regional level, we see yet again that running is a huge component at the CrossFit Games.  Running made up 16% of the total points this year, marking the third straight year with at least 11% of the points.  In every year since 2012, running has been one of the top 3 most valuable movements at the Games.

In contrast to what we saw at Regionals, where Olympic-Style Barbell Lifts and High Skill Gymnastics made up a ridiculous 81% of the points, they made up less than 40% of the total points at the Games.  Aside from running, we saw 30% of the points come from Uncommon CrossFit Movements, including swimming, paddle board, sandbag carry, pig flip, yoke carry, assault bike and peg board climb. 

Wednesday, April 8, 2015

A Look Back at the 2015 Open: Part I

We've all had time to recover from the Open, and for a (very) select few of us, it's time to move onto the regionals.  But at CFG Analysis, we're not quite finished with the Open quite yet.  On the contrary, it's time to take a thorough look back at the 2015 Open, see what the data tells us and start to understand what could be coming in the future.

Like the past two years, I'll be breaking this post up into two parts.  Today in Part I, I'll tackle the programming of this year's Open and how it compared to prior years (and what we may have expected).  Later this week in part II, I'll dig into the leaderboard a bit more to see what we can find.  If you want, see my posts (Part I and Part II) from last year for a feel for what we'll be getting into.

OK, let's get started.  Unless noted, all the metrics in this post relate to the Rx division only.

As I got started on the analysis for this post, my gut feeling was that this year's Open was a whole lot different than the past four years.  Indeed, looking at the Rx division, many of the metrics that I use to evaluate CrossFit programming were quite a bit different than in the past.  But as I looked a little closer, I found that there were really just a few key changes this year.  The biggest, in my opinion, was this:

The Open included a max-effort lift.

If you remove 15.1a (1RM clean and jerk), you're left with programming that is actually pretty similar to what we've seen before.  The chart below shows the men's loading metrics* for 2011-2015, including a version of 2015 that does not include 15.1a.  Note that without 15.1a, things look eerily similar to every other year.  With 15.1a, however, this year definitely put a larger emphasis on heavy lifting and (likely) favored larger athletes more than in the past**.


The loading metrics, of course, don't tell the whole story.  To me, there were three other key differences from prior years:
  1. Handstand push-ups appeared for the first time;
  2. The high-skill gymnastics movements (muscle-ups, handstand push-ups) appeared at the start of a workout, forcing a large portion of the field to scale;
  3. Burpees and box jumps, which accounted for about 20% of the points in the Open in previous years, did not appear at all.
Certainly #2 bothered a lot of people, but for the athletes competing for spots at regionals, this really had no effect on them.  The other two items are somewhat important, and #3 in particular was a shock to me.  As I noted on Twitter a few weeks ago, the 2015 Open was the first time since 2007 that the Open, Regionals or Games did not include burpees (excluding 2010 Regionals, when the workouts varied by region).  The chart below shows the value of each movement in the Open from 2011-2015 (including 15.1a).


Besides the big goose-eggs for burpees and box jumps, note the significance of the clean.  Since being a major player in 2011, the clean had not accounted for more than 5% of the points in an Open until this year.  The inclusion of 15.1a not only made this year a "heavier" Open, but it contributed to the Olympic-style lifts playing a huge role in the standings.  The chart below shows that the Olympic lifts and high-skill gymnastics were valued more than ever in 2015, while basic gymnastics were significantly diminished.


Although this year did include the first max-effort lift in an Open, none of the rest of the events were particularly unusual in terms of load, duration or movements.  The chart below shows the time domain (x-axis), number of movements (y-axis) and LBEL (size of ball) for each Open workout 2011-2015***.  You'll see that besides 15.1a (which I considered a 0-time domain workout despite technically lasting 6 minutes), the workouts were relatively standard compared to past Opens, though a bit on the shorter side.


It is worth noting that the 185/125 clean in 15.4 was the heaviest relative weight (1.37/0.93) ever required in an Open. That being said, I feel that the 165/110 squat clean and jerk (1.23/0.82) in 11.3 was more challenging for the community at that time than the 185-lb. clean was this year.

So where is the Open headed?  Certainly things could change in the next 10 months if there are other changes to the format (multiple scaled divisions, for instance), but it seems that the Rx division of the Open is starting to look like Regionals-lite.  I don't anticipate that the loads will get to Regional levels - the average load in metcons this year was 0.87/0.59, whereas regionals have been averaging 1.12/0.75 in the past.  However, the variety of workouts in the Open seems to be mirroring the Regionals.  I think we could see one or two of these two-part workouts each year, and I'd bet we'll have a max-effort lift each season.

I think we'll continue to see the scaled division evolve (some of the workouts were a little bland this year, in my opinion), but I think the the loads will stay similar to what we had this year, where they were about 70% of what was required for the Rx division.  Now that the community has seen the challenges in the Rx division, I'd expect more athletes to be prepared to scale early and often in the future.  There's no shame in scaling, that's for sure.

That will wrap it up for Part I of my 2015 Open recap.  Stay tuned for Part II later on this week!

*For more background on these metrics, see this post from back in 2012.

**This is something I plan to look into at some point, possibly in Part II.

***For the time-varying and load-varying workouts (including 15.1a), I took the average of the top 1,000 overall finishers from each particular year.  For instance, the top 1,000 overall male finishers took an average of 15.8 minutes on 15.2.  I also considered 15.1a and 11.3 to be single-movement workouts, despite including a clean and jerk.

Monday, March 2, 2015

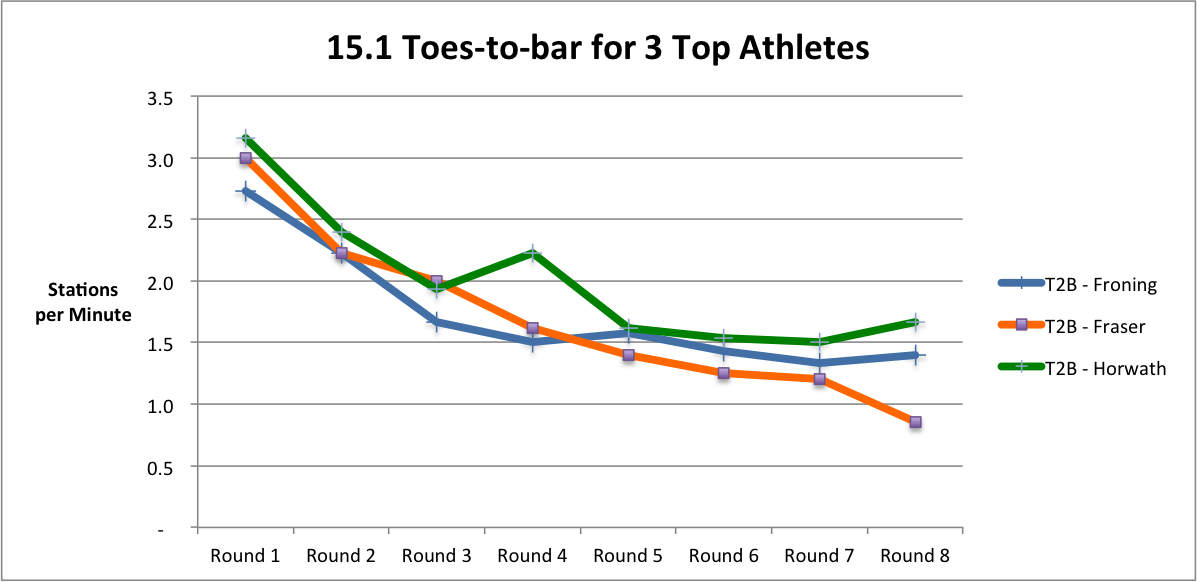
Froning vs. Fraser (vs. Horwath) in 3 Charts

I'll have plenty more thoughts on 15.1 (and 15.1a) on the podcast tomorrow, and I may even go a little more in depth on the blog later this week as well, but I want to keep things short today.  My preliminary analysis (and my intuition) is saying that this was a toes-to-bar workout, but that's not to say that was the only element that mattered at all.  The snatch was also critical, and as we'll see below, transition time on the deadlift actually could be the difference between scores among elite athletes.

Consider three athletes: Rich Froning, Matt Fraser and Brian Horwath.  Brian Horwath?  Yes, Brian Horwath.  As of 6 p.m. ET, he had the highest score on a video submission in 15.1 (229), and he attacked this workout completely differently than Froning (224) and Fraser (219).  Horwath clearly didn't have the barbell strength that Froning and Fraser did, as evidenced by his 255-lb. clean and jerk in 15.1a (still quite respectable, don't get me wrong).  In fact, he did singles on his snatches throughout the workout, but he made up for this with blistering speed everywhere else.

The three charts below show the pace of each athlete on each movement throughout the workout.  Note a few things:
  • The toes-to-bar degrade for all athletes here.  There are few movements in CrossFit where this is as consistent as in the toes-to-bar.  We saw it a few years ago in 13.4, and I see very few, if any, athletes who can consistently bang out sets of 10+ for a workout longer than 5 minutes.
  • Horwath only goes a little faster than Froning and Fraser on the toes-to-bar, but he maintains that lead throughout.  That small advantage was a big factor.
  • Froning and particularly Fraser were much faster on the snatch.  In the 10 or so videos I've watched, no one has come close to matching Fraser's speed on the snatch.  In hindsight, maybe this was not the best strategy.
  • Horwath blazed on the deadlift.  Absolutely no rest whatsoever after getting off the pull-up bar.  That saved him about 4-5 seconds per round on Fraser and Froning.

Remember, there are many ways to win a workout, and in the Open more than any other time, strategy matters.

[Update 3/7/2015 below]
I know we've all moved on to 15.2, but I finally was able to complete a reasonable analysis of how much each movement was valued on 15.1.  I'll skip the deep background on this and instead refer you to this post and this post.  Below are the results, based on a review of 9 elite-level male athletes (all scored at least 190 on 15.1 and hit at least 290 on 15.1a.)

The interpretation of this is that if an athlete goes 1 standard deviation slower than average on the toes-to-bar and 0.5 standard deviations faster than average on the other two movements, that athlete's score will be 7.4% worse than an athlete who is average on all three movements.  In the deadlift column, this represents a scenario where the athlete is slower on deadlifts but a little faster on the other two movements.  In the snatch column, this represents a scenario where the athlete is slower on snatches but a little faster on the other two movements.  

What this is telling us is that athletes are punished most for a weakness on the toes-to-bar, followed by snatch, followed by deadlift.  The spread here is pretty wide, and the deadlift showing a negative-3.7% leveraging is pretty amazing.  If you're not very speedy on the deadlifts, it was not hard to make up for that on the other two movements.  Conversely, if you struggle with toes-to-bar, you are in big trouble.  

From the feedback I've received and seen online, this lines up very much with what people feel intuitively about the workout.  The 7.4% leveraging (at 1 standard deviation) is actually slightly lower than the 7.8% leveraging I observed on 14.1 last year, but we all know that 14.1 was all about the snatch.  And if we compare to what I saw when I looked at Jackie at the 2013 Regionals, the toes-to-bar in 15.1 was far more leveraged than any of those movements (in the original post I adjusted each movement by 2 standard deviations, but when I adjusted that to be 1 standard deviation, the highest leverage on any movement was the pull-ups for women at 2.2%).

Note that this type of analysis is quite time-consuming, so I don't do it that often.  If split times became more easily obtainable, I'd like to do this on a more regular basis, as I find it quite fascinating and potentially useful for athletes.

Monday, November 24, 2014

What to Expect from the 2015 Open

So I'm a little late on my annual "What to Expect" post this year, but you've still got about 3 months left before 15.1 is announced.  That means there's still plenty of time to fine-tune your game, work on your weaknesses and get yourself as prepared as possible for this year's Open.  To help you do that, this post gives you an overview of the type of programming you should expect to face.

For those familiar with my past "What to Expect" posts, nothing here should come as a major shock to you.  But I have updated the numbers based on what happened last year, and I've also got some thoughts on what might change this year due to the changes mentioned by Dave Castro following the CrossFit Invitational a few weeks ago.  For those of you who are new, this should be a good primer on what the first stage of the CrossFit Games competition is all about.  To be sure, it is quite different from what you may have seen on ESPN (hint: you probably won't be pushing any sleds or doing 315-lb. squat cleans for time).

The way this post will be laid out is the same as last year.  I'll pose some questions that many newbies might have, and I'll answer them as best I can based on the information we have from the 2011-2014 Opens.  As I have noted in the past, I won't be covering how you might want to train for the Open in this post, but rather what you should be training for.

Let's get started.


What movements will I need to do?

Fantastic question.  I like where your head is at.  Although the CrossFit Games is all about preparing for the "unknown and unknowable" (do they still use that tagline?), you can expect to face a small subset of movements in the Open.  By my count, there have been 52 different movements tested at the CrossFit Games finals, there have only been 15 tested in the Open.  The chart below shows how much value each of these movements has been given in the past four years, along with the best estimate of what might be to come this year.  All of the "best estimates" in this post give more weight to recent years, but they are influenced to some extent by all years dating back to 2011.


Last year's open had a little wider spread of movements than in the past, but still, you can see that historically, there are a few movements that are tested heavily again and again.  This year, you can expect about 60% of the points to come from six movements: snatch, burpee, thruster, pull-up, double-under and box jump.  Just in those six alone, you can see that there is a jumping theme.  All but the pull-up and thruster involve some sort of jump or explosive hip movement (and you could argue the thruster does, too, especially at higher weights).

It's also worth noting (for all you home-gym folks) that you may need a Concept 2 rower available to be able to compete in the Open.  From 2011-2013, nothing was required other than a barbell, weights, rings, a box and a pull-up bar, but in 2014 there was a workout that involved rowing.  This came as a surprise to many, but now that it's been done once, don't be caught off-guard if it happens again.

In the previous chart, there was also a "Subcategory" listed for each lift (I know a wall ball isn't actually KB or DB, but I put it in there because it's a lift that doesn't use a barbell). Grouping movements by the subcategory can be useful, because it reduces some of the noise and gives us an idea of the type of movements that will be used. For instance, cleans haven't actually been used that much in the Open the past three years, but I wouldn't recommend skipping them in training - the movement pattern is similar to that of a snatch, which is highly valued. Below is a table similar to the one above, but looking at subcategories instead of specific movements.


The big theme here has not changed since 2011.  The focus of the Open is on two things: Olympic-style lifts and basic bodyweight gymnastics. This is partly due to equipment restrictions in the Open, but partly due to the fact that HQ seems to really value those two types of movements when making the first cut of athletes.

For those wondering why I have a category for "Uncommon CrossFit Movements" that has 0% value each year, it's because that category contains things like sled pushes, sandbag carries and swimming that have appeared at the Games but are rarely seen at other levels of competition.


How heavy will the lifts be?

Two years ago, I came up with the concept of average relative weights last year as a way to understand this topic a bit better. There is more background in this post from 2013, but here's the concept: depending on the movement, a certain weight may be heavy, medium or light, so I have normalized the weights prescribed on each workout so that we can get a fairer indication of how "heavy" the lift was. After looking at the normalized loads that were prescribed in the past three years, I applied the average relative weight we've seen to the various lifts to show the average expected weights in this year's Open.


The above graph is useful, particularly for new competitors who'd like to get a feel for what they will have to handle in the Open workouts.  However, there are some other factors to consider:
  • These are only averages. The "heaviest" load required in the Open was a 165-lb. clean and jerk (squat clean and jerk technically), which is roughly equivalent to a 130-lb. snatch, a 290-lb. deadlift or a 145-lb. overhead squat. Last year, I said that HQ would likely never require something that heavy again, but with the scaled division being added this year, I actually think it is possible (but unlikely) to see something that heavy required in an Open workout this year.
  • Once in the each of the past three years, HQ has programmed workouts where the weight starts light (to allow everyone to participate) but gets progressively heavier.  Expect this to happen again in 2015.  For those looking to make the Regionals, you'll likely need to be able to comfortably move weights that are about 75% heavier than the loads shown above (for instance, 165-lb. snatch for men).
  • From 2011-2013, HQ never really went heavy on a "heavy" lift (like the deadlift), rather going with heavier loads on the Olympic lifts.  Last year in 13.3 (deadlift/box jump), they showed that you need to have plenty of weights on hand.  Anyone qualifying for Regionals would have needed to handle plenty of deadlifts at 315 for men or 225 for women.
The chart below illustrates the distribution of weights that have been used in the past.  For workouts where the weights got progressively heavier, the weight used for this chart was the average that would be lifted for a typical Regional-level athlete.  Above each bar on the chart, I've given some examples of the type of movement/loading combinations that would fall into that range.


What types of WODs will be programmed? Will there be any ridiculous chippers like 121201?

First of all, there will not be anything like that workout.  There should never be anything like that.  If you are a gym owner, do not program 20 different movements into one workout.  Please.

Anyway, HQ has made it clear that they believe couplets and triplets are the bread-and-butter, so I'm sorry if you're really awesome at "Filthy Fifty," because it's probably not getting programmed.  We did see a little more variety last year with 14.4 and 14.5, but still, it's going to be pretty straightforward.

In the past four years, we've seen 21 workouts:
  • 20 of them included either one, two or three movements.  One involved five movements.
  • All were metcons (no max-effort lifts)
  • 18 had a fixed time limit, and 2 had a time limit that could be extended if you completed a certain amount of work in the first time limit.  Only one has had a required amount of work.
  • All fixed-time workouts have been between 4 and 20 minutes.  Anyone competing at Regionals would have finished the "for time" workout in less than 15 minutes.
Is it impossible that a max-effort workout will be used this year?  No, not after seeing a few of those in the team series.  But I still wouldn't count on it.  Work on your metcons if you want to qualify for regionals.

The chart below helps to get a sense visually of what combinations of loading, duration and number of movements we have seen in the Open.  Each ball represents a workout, and the size of the ball indicates the load-based emphasis on lifting (LBEL) of that workout. The LBEL is a metric that tells us not only how heavy the loads were, but what percentage of the workout was based on lifting. So if the workout had 135-lb. cleans and burpees, the average relative weight is 1.00 but the LBEL is 1.00x50% = 0.50.  The left-right arrows indicate the time domain was variable; the plus-symbol indicates the weight was variable.  In those cases, I've used the average time/load for Regional competitors.


You'll notice that as the workouts get longer, the weights tend to decrease and the number of movements tends to increase. This is also typically what we see in CrossFit programming on the main site and in most gyms. For instance, programming 7 minutes of burpees (Open 12.1) is torturous, but not unreasonable; programming 20 minutes of burpees is a recipe for Rhabdo.


Are past years really a good predictor of what's to come this year?

In many ways, they are.  We have not seen big shifts in the types of movements tested, and the loading has not drastically changed in the past four years of the Open (although it has been declining slowly each year).  There were a couple of curveballs last year with the 5-movement chipper (14.4) and the for-time workout (14.5), but those workouts were still not wildly different than what we had seen in 2011-2013.

That being said, the introduction of the scaled division this year could change things.  It's all speculation at this point, but as I said a few weeks ago, HQ may be more willing to push the required loading up a bit in the Rx division.  I'd also say that we could see some slightly more challenging movements (such as handstand push-ups).  That being said, I doubt that HQ is going to change the over ally feel of the Open dramatically.  The Open is likely still going to be a test of conditioning primarily, with a modest amount of strength required in order to move on.  The big weights will probably come into play more at the Regional level, and the truly unexpected movements and workouts will be reserved for the Games.

I hope that new and old athletes alike can get some value out of this.  As I've said before, I'm not going to tell you how to train, but I'll try to help you understand what you should be training for.


*Note that for this chart, I considered Open 11.1 a single-modality despite technically being a clean and jerk. Also, in calculating the LBEL for the snatch workouts with varying weights, I took the average weight lifted for someone who reached regionals. This reflects the fact that, while only 75 lbs. is required, for a regional-level athlete, they'll be moving somewhere around 130 lbs. on average throughout the workout.

Tuesday, November 4, 2014

Team Series Thoughts and Site Updates

The first edition of the CrossFit Games Team Series has come and gone, with Team Reebok East pulling off a somewhat surprising win.  One of the big questions coming into the Team Series was what the programming would look like, considering HQ had never put together anything like this before.  With scaled divisions being offered for the first time, how tough would the Rx division be?  Would things look like the Open, Regionals, Games or something entirely different?  With all 12 events in the books, let's take a look at how things shook out.

Loading

As far as the weights used, the Team Series fell somewhere between the Open and the Regional level.  For men, the load-based emphasis on lifting (LBEL) came out to 0.56 for men and 0.39 for women.  The heaviest Open to date was 2011, which came in at 0.51/0.35 (men/women), but typically it has been somewhere around 0.45/0.30.  The 2014 Regionals were in the same ballpark as the Team Series, at 0.58/0.36, but the Regionals have averaged 0.69/0.44 since 2011.  This year's Regionals were particularly low because lifting made up such a small portion (37%).

Weighted movements made up 51% of the Team Series, which is just about the average across all HQ competitions since 2011.  When weights were used in metcons, the average load was 0.87/0.59, which equates to about a 115/80-lb. clean-and-jerk, a 210/140-lb. deadliest and a 90/60-lb. snatch.  These are by no means hefty weights, and in fact, they are quite close to the historical averages for the Open and well below the averages for the Regionals.  But what differentiated the Team Series was the addition of two max-strength events, something we've yet to see in the Open.  These are a big reason that the Team Series seemed to have a bit more emphasis on strength than the Open.


Types of Movements

With 12 events, we did see a pretty good variety of different movements tested, much more so than a typical Open.  In all, 17 movements were tested, including at least one movement from each of the seven subcategories I typically use ("Uncommon CrossFit Movements" were not used, which makes sense due to logistics).  The largest focus, not surprisingly, was on Olympic-Style Barbell Lifts, which comprised 44% of the points, including 14% on snatch and 12% on front squat.  The 44% actually ties for the most emphasis on any one of these subcategories in any HQ competition, tying the 2011 Open, when Oly lifts also made up that same portion.

Aside from the Olympic lifts, we did see that Basic Gymnastics (24%) were not used as much as in the Open (36% average), but more than Regionals (18%).  We also saw Powerlifting-Style Barbell Lifts make up 13%, which is higher than the historical average for the Open (6%), Regionals (10%) and the Games (3% since 2011).  That was due in large part to a 2-rep max bench press, which is actually the first time bench press has ever been used in an HQ competition.  No wonder Camille said the last time she maxed on bench press was "in a dream."


Time Domains

This one is hard to assess because the team setting often makes it difficult to compare the length of an event in this competition to, say, an event from the Open.  There is often plenty of built-in rest throughout some of these team chippers that a 20-minute team workout with four athletes working together might not feel any more grueling than an 8-10 minute Open workout.  All-in-all, the focus in the Team Series seemed to be more on power output over short time frames and being able recover quickly, rather than the ability to grind out long workouts and keep a steady pace.

Overall

The team series, to me, seemed like a nice blend of the inclusiveness of the Open with the heavier, more challenging movements of the Regionals.  Athletes who had the ability to go heavy or excel at some more challenging gymnastic movements were able to do so, but anyone who is capable of finishing all the Open events would be able to complete the Team Series workouts (provided they had capable teammates).  Although some of the events were a little bland (still can't believe they opened with that dull 14.1/11.1 remake), there were some pleasant surprises that kept things interesting (such as the burpee-box jump/squat clean ascending ladder).

Are there kinks to be worked out?  Certainly.  I also don't think the Team Series will ever be quite as popular as the Open.  I think the feel of the Team Series is necessarily going to be more low-key than the Open due to its position on the calendar.  But that doesn't mean there isn't a place for something like this.  Hopefully HQ will continue to refine what they have and make this an annual event worth looking forward to for the masses.


Site Updates

The Team Series was the first open HQ competition since 2009 that I haven't been a part of (I even competed back in the "Sectionals" back in 2010).  The Open will almost certainly be the second competition I sit out.  The day after last season's Open, I injured my back deadlifting, my second back injury in 6 months.  I have taken things very slow coming back from this one, and opted to skip the Team Series despite feeling 75-80% healthy.  However, in my recovery from the back injury, I looked into some lingering hip pain and found that I had a pretty significant hip impingement and labral tear (the impingement is genetic and was bound to flare up at some point). I will be having surgery to repair the tear and clean up the impingement soon, but that means a recovery time of 4-6 months.

I've also been studying for my latest (and hopefully last) actuarial exam, which I just took last week (results still pending).  All this combined with dealing with a one-year-old baby have made it challenging to make time for the web site.

I say this not because I plan to retire this site or give up on CrossFit.  Rather, I hope that you can continue to bear with me over the next few months if updates are not quite so frequent (though I don't plan to go dormant).  My hope is that in time, I can be back to CrossFitting and blogging on a much more consistent basis.

In the meantime, get your SWAG's ready - the Open is only 3 months away!

Saturday, August 30, 2014

The 2014 Games Were Heavier, Higher-Skill and Shorter Than Recent Years

Welcome back for another relatively quick one.  Today I'm going to hit a few highlights of the analysis I've done on the programming at this year's Games.

As the title would suggest, the big point here is that this year's Games were heavy and high-skill. Conversely, in comparison to prior years, they weren't as much about stamina, endurance and generally managing fatigue.

Let's consider the first point.  The chart below shows two key loading metrics for men for all eight CrossFit Games.  For those unfamiliar with these metrics, start here.


The load-based emphasis on lifting (LBEL) is always the first place I look when evaluating how "heavy" a competition was.  It gives us an indication of both the loads that were used as well as how often lifts were prescribed.  The LBEL at this year's Games was 0.89; the next-highest was 0.73 back in 2009.

The high LBEL in 2009 was based partly on the fact that there were two max-effort events out of eight total.  In metcons, the loadings were actually quite light at that time.  But in 2014, the met cons were heavy as well.  The average relative weight in metcons was 1.43; the next-highest was 1.36 in 2013.  For context, a 1.43 relative weight is equivalent to a 193-lb. clean, a 146-lb. snatch and a 343-lb. deadlift.  These are average weights used in metcons; the days of the bodyweight specialist competing at the CrossFit Games are over.

The women's numbers tell a similar story.  The LBEL was 0.62, about 30% higher than the previous high of 0.48 in 2009.  The average relative weight in met cons was 1.01, significantly higher than the next-highest (0.88 in 2013).  The 1.01 is on par with the men's loads from 2007-2010.

Not only were the Games programmed heavy, but the athletes are just flat-out getting stronger.  The chart below shows the relative weights achieved during the max-effort lifts in the Games historically. These represent the average across the entire field (except in 2007, when I limited the field to the non-scaled participants only).


Not only was the men's average of 2.71 in the overhead squat well above the previous high of 2.36, but the women's average of 1.80 is higher than the men achieved in the CrossFit Total in 2007 and the Jerk in 2010 (granted, that lift occurred within 90 seconds of the Pyramid Helen workout).

Now, as far as the high-skill comment, consider the types of movements that were emphasized at the Games.  I generally categorize movements into seven broad groups: Olympic-Style Barbell Lifts, Basic Gymnastics, Pure Conditioning, High Skill Gymnastics, Powerlifting-Style Barbell Lifts, KB/DB Lifts and Uncommon CrossFit Movements (sled pulls, object carries, etc.).  The two that require the most technical ability are High Skill Gymnastics (such as muscle-ups and HSPU) and Olympic-Style Barbell Lifts.

This season, Olympic-Style Barbell Lifts accounted for 32% of the total points, which is second all-time (2008 they were worth 38%).  The High Skill Gymnastics movements accounted for 17%, which was only topped once (2010).  Combined, those two groups accounted for 49%, which is second all-time.  The only year with a greater emphasis was 2010, which actually included the incredibly challenging ring HSPU.  Still, the sheer volume of high-skill movements required of athletes was far higher this year.  The muscle-up biathlon included 45 muscle-ups; in 2010, "Amanda" was crushing about half the field with just 21 muscle-ups.  The ring HSPU were tough in 2010, but were they more challenging than the 10-inch strict deficit HSPU this year?  Remember, women were only required to do regular HSPU back in 2010, and only 28 of them.  These days, 28 regular HSPU is nothing for the elite women's athletes.

On the flip side, this Games had much less volume than recent years.  The chart below shows the longest event (based on winning time), the approximate average length of all events (including finals) and the approximate total time that athletes competed, dating back to 2011.  It's clear that this year was much less grueling than the past two seasons, and it was very similar to 2011 (including starting with a ~40-minute beach workout).


The theme of this year's Games was strength and skill, not stamina.  Why?  Well, I have to believe television had something to do with it.  This year's events were more spectator-friendly across the board, and they may set the stage for future seasons in which every event is broadcast on cable (ESPN won't be showing a 90-minute rowing workout, that's for sure).  People don't like to watch events that take forever, but they do like to watch people lift heavy stuff and generally perform feats of strength and skill that make you say "I could never do that."

My hope is that the Games can continue to be spectator-friendly without losing the events with that "suck factor" that we in the community know and love.

Tuesday, June 10, 2014

2014 Regional Review

Every year, watching the Regional competition, seeing how incredibly difficult it is to qualify for the Games even for the most seasoned of athletes, it's hard to imagine that those who do qualify have any weaknesses. Yet in a few short weeks, we will once again see the programming elevate to yet another level, exposing any deficiencies and allowing the best of the best to shine. Even with a few big name athletes out of the mix, it's going to be another tremendous competition, possibly the best to date (the women's side in particular is WIDE open).

But before we move fully into Games mode, let's take a more thorough look back at this season's Regional competition.

First, we'll start with the programming. Although I thought the programming was solid this year, I still preferred last season's events a bit more. A big reason for that is the handstand walk event - I simply cannot get over the fact that a single attempt at walking on one's hands was worth the same amount of points as classic CrossFit metcon like event 3, event 4 or event 7. It just seems to me that if you're evaluating an athlete, those other events tell you a lot more than a handstand walk. Part of that is opinion, but it is also backed up by the numbers. Below is a chart showing the correlation between an atahlete's ranking in each Regional and Open event this season and the athlete's ranking across all other events. Higher numbers indicate that the best overall athletes are typically finishing high on the event, which generally means the event was a good test of fitness.


As I noted last week, the events that really stood out on the positive side were Regional Even 3, Regional Event 7 and Open Event 4. All three had correlations near 80% for both men and women. I've admitted already that my doubts about Regional Event 7 were unfounded, but I'll state it again: this was a pretty great event. On the flip side, you can see that the handstand walk (Regional Event 2) had one of the lowest correlations for both men and women, although the run/rope climb workout (Regional Event 5) had the lowest correlation of any event. My theory here is that since most other events generally favored smaller athletes, many top athletes on the other workouts struggled a bit here since the height was a clear advantage.

Which brings me to a second topic on the programming: did the Regional programming really favor smaller athletes, as many (including me) expected it would? This came up on the Update Show last week, and predictably it was dismissed as being a myth. The evidence? Well, since Tommy Hackenbruck, Jason Khalipa and Elizabeth Akinwale all qualified, the programming must not have favored smaller aithletes, according to Pat Sherwood. Needless to say, as a stats guy (and just a fan of the sport in general), hearing this topic brushed off so casually was irritating for a number of reasons:

  • Anyone who knows anything about data knows that you can't prove a point like this simply by cherry picking a few oddball cases. Can we assume height is not advantageous in basketball because Nate Robinson is in the NBA? Of course not.
  • Tommy Hackenbruck is not even that tall. The man is 6'1", so let's keep things in perspective here. And Elizabeth Akinwale is only 5'7"!
  • As much as HQ talks about data points and all the insights they can gain from the numbers, we so often get responses like this instead of actual analysis. HQ has the numbers at their disposal to provide better evidence to support their point, yet they choose not to. I love this sport, but we lose credibility when the organization in charge so rarely admits any fault.
None of this is to say that Sherwood was necessarily wrong. His opinions were simply not supported by facts. That's what is irritating.

However, the numbers are available to see if the HQ company line is in fact correct. I spent a couple of hours compiling the heights and weights of male Games qualifiers from the past three years (I'd like to get the female numbers at some point when I have some more time). Here are the raw averages for the field in those years:
  • 2012 - 69.9 inches, 198 pounds
  • 2013 - 69.9 inches, 197 pounds
  • 2014 - 69.4 inches, 192 pounds
Clearly there is a drop in size in the past year, and if we throw out the bottom and top two values from each year (including 6-foot-5 Aja Barto in 2012 and 2013), the trend actually becomes a bit more apparent.

  • 2012 - 69.9 inches, 199 pounds
  • 2013 - 69.7 inches, 196 pounds
  • 2014 - 69.4 inches, 192 pounds
Now, is this a drastic drop? No. But the fact that the average size of the Games athletes is a half-inch and 5 pounds lighter than a year ago is not meaningless. Perhaps you could argue that the programming in prior years was too favorable towards larger athletes (I wouldn't argue that, but you could). But to just ignore the numbers altogether is a bit disingenous.

Something else that came out of this investigation (which I hope to expand on at a later date) was that I decided to look at how the distribution of heights for Games qualifiers compared to the general population. My theory was actually that since the programming is generally so balanced, we'd see that the Games athletes have a distribution of heights that are pretty typical. Below are the comparisons (Games athletes distribution based on the qualifiers from the past three years combined, general public data from the Census bureau).


Although the shape of the distribution isn't terribly different, we do see that Games athletes are more concentrated around the average (approximately 5-10) than the general public. In fact, this has been a trend in recent years. The standard deviation in height among Games qualifiers has dropped from 2.4 inches in 2012 to 2.1 inches in 2014, and the standard deviation in weight has dropped from 15.9 pounds in 2012 to 13.2 pounds in 2014. I expect this will continue in the future as the field grows and it becomes harder and harder to overcome any natural disadvantages.

This brings me to my final topic for today: who were the most impressive athletes at this year's Regionals? Obviously, Rich Froning remains the dominant athlete on the men's side, staying well clear of the field despite (reportedly) battling a nasty cold all weekend. And for sure, Scott Panchik again showed that he's a podium contender by hanging right with Froning (and also finishing well ahead of the third-place athlete in the Cross-Regional Comparison). On the women's side, clearly Camille showed up big-time, as she typically has in past Regionals.

But considering what we saw above regarding the concentration of "average size" athletes, it does make performances by athletes like Hackenbruck, Nate Schrader (6'1") and Becca Voigt (5'9") even more impressive. In fact, I'd venture to say these athletes will do even better at the Games, since the programming could be more favorable to their size. Hackenbruck and Schrader were both in the low 20s in the Cross-Regional Comparison (the best of any athletes over 5-11), and I could easily see both in the top 10 at the Games.

That's it for today. In the next few weeks, we'll get into adjusting those Cross-Regional Comparisons, and of course, assessing who actually could win the CrossFit Games. Until then, enjoy your training, and I'll see you back here soon.

Thursday, May 8, 2014

Quick Regional Programming Thoughts

As much as I was hoping to have my regional predictions set up to go this week, I wasn't able to make that happen. A confluence of events over the last month - a 5-hour actuarial exam, a trip out of town to have my son baptized, my wife's birthday and numerous trips to the chiropractor/ART to try to fix some back issues that flared up after the Open - pretty much made that impossible for me. By next week, I do expect to be able to produce my stochastic regional predictions (like I did for the final two weeks of last year's season). But for this week, your guess is as good as mine about who will claim the first 24 spots at the Games.

That being said, I did have time to do a bit of work assessing the programming for this year's Regionals. Here are my thoughts:
  • Overall, I like the programming. In particular, I think events 3-6 seem to me to be well-balanced workouts that should be fun to watch.
  • Events 1 and 2 introduce a ton of volatility into the situation. Only getting 3 attempts on the hang snatch means we could see some top athletes get burned by taking a gamble on those 2nd and 3rd lifts. And a max handstand walk on a single attempt gives plenty of opportunity for a catastrophic failure that could cost an otherwise fit athlete a shot at the Games. In my opinion, I don't think this event really helps us find the fittest athletes, and it may end up preventing some really stellar athletes from making it.
  • Event 7 is really a wait-and-see event for me. It seems like a really weird design for a workout to have just 8 reps of the overhead squat, since it doesn't seem like it gives enough time for athletes to make up ground on that movement. But hopefully I'm wrong and this event turns out to be a better test of fitness than it appears to be on paper, especially considering it's the finale.
  • This year's regional is in some ways the heaviest regionals to date and in some ways the lightest. When weights are involved, the average relative load (1.55 men, 0.98 women) is the highest in the past four years. However, the programming is only 37% lifting, the smallest percentage of any Regionals. In fact, the 2011 Games is the only HQ competition with a lower percentage (34%).
  • When you combine those two factors, you get an load-based emphasis on lifting (LBEL) of 0.58 for men and 0.36 for women, both slightly lower than 2011 and 2013 and much lower than 2012. The chart below shows the progression of each of these metrics at the Regionals since 2011.

  • All-in-all, I believe this year's Regionals look more like the Games than in any past year. And what that means to me is that the emphasis is on strength, both in terms of weightlifting and very challenging bodyweight movements (like legless rope climbs or strict handstand push-ups). Don't get me wrong, you can't do well here without a high level of conditioning, but you will be punished much harder for lacking in strength.
  • Look for handstand push-ups and legless rope climbs to completely decimate the women's leaderboard. With the legless rope climbs, we saw how much variability there was at the Games last year. As far as handstand push-ups, keep in mind that before kipping became common (think 2011 and earlier), this was an extremely difficult movement for many top women, even at the Games.
  • With that in mind, here are some athletes that should do well this programming: Lucas Parker, Josh Bridges, Lacee Kovacs, Chris Spealler, Matthew Fraser, Elizabeth Akinwale, Talayna Fortunato, Annie Thorisdottir, Camille Leblanc-Bazinet.
  • Beyond those names, all the podium athletes from last year's Games should do fine. I'm just not sure they will fare any better because of this programming.
That's it for today. I hope you all enjoy the opening weekend of Regionals, and I'll see you again next week.

Saturday, April 19, 2014

A Look Back at the 2014 Open: Part I

As I did last year around this time, today I'll be starting my review of the 2014 CrossFit Games Open. Of course there will be limitations to what this analysis will be able to cover, partly due to the data I'm able to get at this point (I am hoping to eventually pull down all the individual stats, like Fran time, max deadlift, etc.). Still, I think there is enough data out there to help us further our understanding of the current state of our sport and where we may be headed. Like last year, I'll be breaking this post up into two parts. To start, here is a list of topics I plan to cover, followed by a list of things I will not be touching on in this post:

Will cover:
  • Breakdown of the programming of this year's Open, much like my "What to Expect from the Open" posts from fall 2012 and fall 2013 (Part I)
  • Correlations between events this year, compared with last year (Part II)
  • Comparison of performance by new competitors vs. returning athletes (Part II)
  • Comparison of 11.1 and 14.1 results (Part II)
  • Attrition in this year's Open, compared with past years (Part II)
Will not cover:
  • Comparison between regions (don't have region information on the data at the moment)
  • Breakdown by age group (don't have age information, either)
  • Predictions for regionals (coming in the next few weeks)
  • Probably lots of other subjects that I simply didn't think of. If you have suggestions for future analysis, by all means, post to comments or email me.
Finally, here are some notes on the data set I am using for any work dealing with the results of the Open (thanks again to Andrew Havko for helping me pull this data, along with the 2011 Open results, which I've been wanting to get my hands on for some time):
  • Excluded any athletes who did not complete all 5 events. This simply makes for fairer comparisons. I did look at all scores in order to calculate the number who dropped off each week, but that is it.
  • Masters competitors (54 and under, since older groups are scaled) are lumped in with everyone else. As mentioned above, I don't have age information this dataset since I pulled it straight off the worldwide leaderboard.
  • I have re-ranked athletes on each event among the athletes in this dataset.
  • Athletes were identified as returning athletes if their full name was in last year's dataset. There are multiple athletes with the same exact name, but I had no way around this without region or age information. I assume any impact here is minor. The one manual fix I made was to make sure the Ben Smith at the top of the leaderboard was matched up with the correct Ben Smith from last year's data. 
So let's get started.

We'll start with the programming this year. I generally liked the programming this year (although it certainly didn't play to my strengths), mainly because HQ finally threw us some curveballs and some workouts that I didn't expect. Among the things we saw this year that hadn't occurred in previous Opens:

  • Rowing
  • A workout for time (rather than AMRAP)
  • A workout with more than 3 movements
  • Weights over 300 pounds for men and 200 pounds for women
  • Pull-ups and thrusters not in the same workout

Having said that, the Open is still the Open, and many things remained the same or similar as prior years. For instance, the loading was still much lower than the Regional and Games level. In fact, by my measurements, this was the lightest Open yet. Below is a basic comparison of the average loading* used each year in the men's competition (the pattern is the same for women).


The average relative weight was down from all prior years and there less than 50% lifting, which meant that the load-based emphasis on lifting (LBEL) was down about 10% from the historical average**. An investigation for another day is whether this Open favored smaller athletes because of that lower LBEL.

Now let's take a look at which movements have been used across the three years, and how they have been valued. This is presented slightly different than last year: each value represents how much that movement was worth as a percentage of the total for that season. The reason for presenting it this way (as opposed to counting total events) is that 2011 had six events and the other years had five, so this accounts for the fact that each event was not worth as much in 2011.


We see that this year, the programming hit almost every movement that has been used at any point in the past (push-ups and jerks were the exceptions) and added one new movement (rowing). Not surprisingly, we see the same movements being emphasized as in prior years: snatches, burpees, thrusters and pull-ups. One interesting note is that this is the first year in which no movement has accounted for more than 10% of the total points. However, the caveat here is that this methodology assumes all movements in a given workout are valued equally. In reality, there are instances where this is not necessarily true: for instance, most people would agree the deadlifts were valued far more than the box jumps in 14.3

As in past years, you'll also notice that the Olympic-style lifts and derivatives (thruster, overhead squat), as well as basic gymnastics movements, were the biggest keys to Open success. However, we did see a bit more value placed on other areas, such as powerlifting (e.g. deadlift) and pure conditioning (double-unders, rowing). Although Castro did surprise us with a few things this year, I still think it's a safe bet that the more advanced movements you might see at the Games (e.g. ring handstand push-ups, heavy medicine ball cleans) are not going to be tested in the Open. That's not to discount the usefulness of these other skills in training; it's just that you're not likely to see that tested until at least the regionals.

Finally, here's a chart I put together showing the relationship between loading, the number of movements, and the length of workout in the past three years of the Open. This chart was shown last year, but I have added the 2014 workouts, which are represented by the red balls. In the chart below, the x-axis represents the time domain, the y-axis represents the number of movements*** and the size of each bubble represents the LBEL of that particular workout (roughly how "heavy" was each workout). A plus-symbol indicates the weight varied during the workout and the arrows indicate the time varied for the workout****.


This year's workouts, although unique in how they were programmed, still didn't stray too far from what we've seen in the past in terms of loading and time domain. Keep in mind that for the above chart, I'm using averages for the variable-weight event (14.3) and variable-time events (14.2 and 14.5). For many CrossFitters, they did see a very long workout in 14.5 (which took many people beyond 20 minutes) and a very short workout in 14.2 (which only lasted 3-6 minutes for a majority of the field).

You can still observe some general trends here, which are often true of CrossFit programming in general. The shorter workouts tend to involve fewer movements and can occasionally go heavy, while longer workouts can potentially involve 3 or more movements but generally have light-to-moderate loading.

That's it for Part I. In Part II, which I expect to be out this week, I'll be focusing more on the results of this season's Open. See you soon.


*For background on these metrics, please see my post "What to Expect from the 2013 Open and Beyond." You may notice that the loading for prior years has changed slightly, which is due to me updating the relativities between lifts as I gather more data.
**For any workout with a variable element, such as the weight in 14.3 or the time in 14.2 or 14.5, I used the average of the top 1000 athletes. This is consistent with prior years.
***I considered the 11.3 a single-modality for this chart even though it technically included cleans and jerks.
****Workout 13.5 is actually hidden from view here because 14.3 is covering it up (same time domain and number of movements). Workout 13.5 was also a variable-time workout and would have had the arrows on the ball.

Monday, March 3, 2014

Quick Hits: Open 14.1 Initial Thoughts and Analysis

So, all of us misfired on our SWAGs this week, although give John Nail credit for almost calling a repeat of 11.1 before overthinking it and going in a different direction. KISS principle, John.

Anyway, with 14.1 being a repeat workout, many of us knew about what to expect from this one. I personally had done it 4 times before, so I knew what I was getting into. But as is often the case with CrossFit, you always find yourself learning something new. One thing I found was that I actually benefited from mixing in clean-and-jerks with the snatches. In the past, I think my pride had gotten the best of me and kept me from using the C&J, but I actually found them very helpful. Around the midpoint of the workout, I started using a clean-and-strict press for about 2/3 of my reps. I found the strict press to be nice because it took the stress totally off my legs for a brief moment. I ended up with a PR by 30 double-unders + 2 snatches (score of 302), but I think I'm going to give it one more shot tomorrow and mix in even more C&J's early on.

That being said, I personally would have preferred that the workout required the snatch. I think the option to use C&J's is basically a loophole that was exploited a lot more than perhaps HQ anticipated, much like the step-ups last year in 13.2. For many people, they won't even need to perform a single snatch during the Open, since it's unlikely (but possible) snatches will be programmed again.

I also spent a bit of time this afternoon reviewing video submissions to do a quick version of the leveraging analysis that I did for several Open workouts last year (as well as Jackie from Regionals). The concept here is to look at the average pace for each movement and the variability of the pace for each movement, which will then allow me to understand which movement is more leveraged. By leveraged, what I mean is a measure of how much an athlete's score will suffer if he/she struggles with a particular movement. See my post "How is Jackie Being Won?" from last May for more details.

Today's analysis is based on reviewing 10 male athletes who scored between 303 and 356. These are the type of athletes who will be fighting for those final regional spots. The analysis would certainly look different if we looked at a more average athlete or at a Games-level athlete. In particular, the average athlete may struggle more with double-unders, but this analysis assumes that the athlete is at least competent with double-unders.

Note that for the sake of time, I timed a couple of rounds for each athlete toward the middle of the workout. Their overall pace was probably slightly faster, but the overall message here is still valid, in my opinion.


Those final leverage figures mean the following:

  • An athlete who is 1 standard deviation worse on the double-unders but 1 standard deviation better on the snatches actually finishes 1.9% better than an athlete who is average at both movements.
  • An athlete who is 1 standard deviation worse on the snatches but 1 standard deviation better on the double-unders finishes 7.8% worse than an athlete who is average at both movements.
Basically, an athlete that struggles a bit with the double-unders can make up time on the snatches, whereas an athlete who is slower on the snatches will have a hard time making up enough ground on the double-unders. Interestingly, the coefficient of variation was almost identical for each movement (17% for double-under and 16% for snatches). However, the snatches took nearly twice as long on average, which is why we see that they were so much more valuable.

If there's anything to take away from this, it's that pushing the pace on the double-unders at the expense of snatches does you no good. Gather yourself during the double-unders, and be ready to roll on the snatches. (Easier said than done, of course.)

Well, that's it for today. Good luck for all those hitting this workout on Monday, and I'll see you back here Tuesday night for our SWAG for 14.2.

Friday, December 20, 2013

Are CrossFitters Specializing?

For the past seven years, the CrossFit Games have sought to find the fittest all-around athletes in the world. One common theme from CrossFit HQ is that the Games seek to "punish the specialist" and "reward the generalist." However, one can't help but notice the increased attention that certain aspects of fitness seem to garner in the CrossFit community compared to others. In CrossFit media, the emphasis on lifting, and Olympic lifting in particular, seems to be disproportionate to many other areas of fitness. When was the last time you saw a video or even a note on the Games site mentioning a Games athlete hitting a new PR in his 5K run? Yet it seems like it hasn't been 24 hours since we've seen a video posted of another athlete hitting a big snatch or clean and jerk.

OPT noted this phenomenon on his blog about a year ago:

"Media recently for the sport has put an emphasis on strength development in spite of promoting true “balance” in fitness and the general components of fitness.  A sport where now the elite can qualify for the American open weightlifting championships but cannot qualify for a state-level high school cross country meet."

Although I won't seek to prove it in today's analysis, I think there is little doubt that the big lifts tend to get a lot more attention than general metabolic conditioning in CrossFit media. However, the question I will attempt to answer is whether the sport itself has gotten out of balance.

From the programming perspective, I showed in my recent post "History Lesson: An Objective, Analytical Look at the Evolution of the CrossFit Games" that while the metcons have become heavier and heavier over time, the overall balance of lifting and conditioning has not changed drastically in the past 7 years. In addition, there is roughly the same amount of emphasis on Olympic lifting now as there has been throughout Games history. In fact, there has actually been a shift away from the powerlifting-style movements like the deadlift and back squat. Running is and has always been the most common movement at the CrossFit Games.

However, there is a legitimate question about the intense focus on Olympic lifting and the lack of focus on running at the Regional level. And there is also no doubt that the CrossFit athletes have been getting more and more proficient at the Olympic lifts, as evidenced by the rising numbers in the 1-rep max events at the Games each year.

So let's ignore the programming for now and focus on the actual strengths and weaknesses of the athletes in our community. Before I do this, I want to re-visit the comment from OPT above. I love OPT and have probably watched every CrossFit.com video of his over the past few years, but I think the commentary that "the elite can qualify for the American open weightlifting championships but cannot qualify for a state-level high school cross country meet" is a bit misleading on a couple of levels:
  1. The American Open is not that competitive on a global scale. To qualify in the 85 kg weight class, you need a 266 KG total (http://0205632.netsolhost.com/2013NationalEventsQualifyingTotals.pdf). Yet at the 2012 Olympics, the 16th place finisher had a total of 315, or 18% higher. On the other hand, to qualify for the highest-level state cross country meet in Ohio (a competitive state where I used to cover sports), you need a time around 17:00. Considering these meets are run on rugged terrain rather than on a track, this time isn't that far behind the Olympic 5,000 meter times (13:52 was 15th place in the 2012 Olympic final). So I think it could be argued that qualifying for those two events are actually relatively comparable as far as difficulty.
  2. There are weight classes in Olympic weightlifting, yet there are not in CrossFit or cross-country. The top CrossFitters are not even in the same stratosphere as the lifters in the 105KG+ weight class. On the flip side, among runners above 200 lbs., I have to believe someone like Garrett Fisher would be considered elite.
But let's look at the numbers throughout our community. To do this analysis, I used the 2013 Open data, which was generously pulled and cleaned for me by Michael Girdley (girdley.com). This dataset has all the numerical information provided by athletes who competed in the Open (it does not include answers to the questions about diet, how long you've done CrossFit, etc.). Based on this self-reported data, I believe we can understand how CrossFit athletes from top-to-bottom compare to the world's best in a variety of lifts, running events and metcons.

To perform this analysis, I first limited the data to athletes under 40 who completed all five events (approximately 39,000 men and 23,000 women). Then I re-ranked all the athletes based on their rank across all 5 Open events and grouped them into 20 buckets based on this rank. Within each bucket, I took the average for each of the self-reported scores (Fran, Helen, Grace, Filthy 50, FGB, 400 meter run, 5K run, clean and jerk, snatch, deadlift, back squat, max pull-ups). For the timed events, I converted these to a pace (rounds per second, for instance, or meters per second). Then, I pulled in world records for each and compared the CrossFit community against those world records.

The charts below shows how the community compares to the world records*. For the lifting events, these are the world records without regard to weight class, since CrossFit does not have weight classes. To reduce clutter, I have grouped all metcons together, all runs together and all lifts together (pull-ups stayed in their own category).


On both charts, we can see that the community is generally closest to the world record when it comes to running events and (not surprisingly) metcons. When compared to the world record in the lifts, it becomes obvious how far behind the CrossFit world still is. Proud of that 200-lb. snatch? Congratulations, you are slightly below half the world record. (Note: I am proud of my 200-lb. snatch, and it took me 5 years to finally get there).

But let's also look at the Games athletes in particular and see how they stack up. Here is a table showing each event and how the average Games athlete stacks up compared to the world record.


Not shockingly, the Games athletes are near the top to the world record in the metcons (since generally the world record comes from this field), but again, note that they are much closer to the world records in the 5K run and the 400 meter run than they are in the Olympic lifts. And look at that back squat - not even close! (and before you ask, this is comparing against the raw world record in the back squat, which appears to be 450 KG as best I could tell)

It is interesting to note that the elite CrossFit men are closer to the Olympic lifting world records than the elite women, yet they are further from the 5K run record. This could have something to do with the background that many of the athletes had prior to CrossFit, but that's purely a guess at this point.

Another way to look at this is to understand where the Games athletes excel furthest beyond the rest of the community, and in particular, where they excel furthest beyond the rest of the Regional field. For both men and women, here is a look at how the top 5% of Open finishers (roughly the Regional field) compared to the Games athletes.


Here I think we start to see something interesting. While the Games athletes do not appear to be any further from the world record in the 5K run than they are in the Olympic lifts, they aren't that much better than the rest of the regional field when it comes to the running events. They also aren't that much better when it comes to the powerlifting movements. I think you could attribute at least partially to programming at the Regionals: we simply aren't testing much for running or powerlifting, so the athletes making the Games aren't necessarily that much better than the rest of the field in those areas.

On the flip side, look where the Games athletes do exceed their peers by a greater amount: the Olympic lift, the short metcons and pull-ups. It seems that explosive power and conditioning (over a relatively short time frame) are what tend to separate the Games athletes from the rest of the Regional field.

One last way to look at this is to see the gap between the Regional athletes and the median Open athlete**, which is defined as the athletes finishing in 45th-55th percentile in the Open among people under 40 who completed all 5 events. These median Open athletes are still generally fit individuals, they just aren't quite at the Regional level.


This table looks a lot like the prior one, meaning that what separates the Regional athletes from the average Open athletes is a lot like what separates the Games athletes from the Regional athletes.

Based on the analysis here, I believe that CrossFit athletes in general aren't bad runners or particularly tremendous lifters. However, the elite CrossFit athletes are significantly better lifters than the rest of the community, and yet they are not drastically better runners than the rest of the community. From this perspective, we do see a little bit of the bias that OPT was writing about. But overall, I don't think the specialization issue is as much of a concern as some might think.

Update 12/20: [I'd like to note that I don't believe that achieving 70% of the world record in the snatch is exactly as challenging as achieving 70% of the world record pace in a 400 meter run. However, the fact that CrossFit Games athletes are so much closer to the world record in the running events than they are in the lifts indicates to me that these athletes should not be considered specialists in the Olympic lifts who simply neglect running. One way to quantify this, which I'm hoping to look into more, is to put things in terms of standard deviations. I have looked at this for the snatch, clean & jerk, 5K run and 400 meter run for men, however. Using the standard deviation based on the same sample of Open athletes under 40, the Games athletes are approximately 6.0 standard deviations below the world record in the lifts but only 4.3 standard deviations away in the 5K run and 2.0 standard deviations away in the 400 meter run. This isn't a perfect method either, but again, it supports the idea that Games athletes aren't totally specializing in the Olympic lifts while neglecting their running.

However, I do see the same pattern as in the main body of my post when comparing Games athletes to the rest of the CrossFit field. Games athletes are only about 1.1 standard deviations better than the median in the 400 meter run, 0.7 standard deviations better in the 5K run, but approximately 2.5 standard deviations better in the Olympic lifts. So it seems that the same conclusions generally hold when doing the analysis this way.]


Update 12/21: [As a follow-up to the previous update, I looked at where the average Games athlete would fall in the spectrum of all Open athletes in each of the self-reported metrics. This was more difficult than it might seem because of the tremendous selection bias in the data (only about 20% of the men's field reported a 400m time, for instance, but about 50% reported a deadlift max). I tried to account for this by creating a "weighted" distribution, where each 5% bucket was only worth the same number of total athletes, regardless of how many missing values they had. After doing this, I found that the average male Games athlete is in the top 2% in the clean and jerk and snatch, and they were at least the top 6% in all other lifts or metcons. However, for the 400 meter sprint, they were only in the top 15%, and in the 5K run, they were only in the top 25%.

Note that the selection bias still can't be totally accounted for. It's probably fair to assume that the non-responders in general had worse scores than those that did respond, so maybe the Games athletes are actually even better than they appear here. However, it is definitely striking that the Games athletes are not that far beyond their peers in the runs, particularly the 5K. Still, it doesn't necessarily say they are bad runners, as you could argue that CrossFitters in general are good runners and therefore the Games athletes are still pretty good. It is clear, however, that Games athletes are outdistancing their peers substantially in the Olympic lifts, even though they are generally still well short of elite status. 

I think a lot of this has to do with the background of many CrossFitters. Many, many people ran to stay in shape prior to finding CrossFit, but relatively few Olympic lifted. To really decide if you feel the sport of CrossFit has gotten too specialized, I think all of the preceding analysis has to be taken in together, including how far CrossFitters are from the world records as well as how the Games athletes compare to the rest of the field. I'm not sure there is really a clear-cut answer.]

Update 12/28: [Quick one here. I did the same analysis for the women that I did for the men on 12/21, and I found that the women's Games were slightly more dominant across the board. The average Games athlete would be in the top 3% for all lifts and metcons, the top 9% for the 5K run and the top 15% for the 400 meter sprint. Interesting that they were comparatively better than the men in the 5K, although actually about the same in the 400 meter sprint. I'm not sure I really have a good hypothesis for this at the moment.

Also, worth noting is that I looked into the response rates for each metric, and found that for women, the rate was between 7% and 12% for all runs and metcons, except Fran, which was 17%. The response rate was between 32% and 38% for all the lifts and 16% for max pull-ups.

For men, the rates were between 13-23% for all metcons, except Fran, which was 33%. The response rate was between 44% and 51% for all the lifts and 30% for max pull-ups.

This does indicate that there is a selection bias issue that has to be considered, but it's not as if it ONLY applies to the runs. Basically all the metcons and the runs had very low response rates, but the lifts had much higher response rates.]

*Here are the world records I used in this analysis, based on a combination of web research and self-reported PRs from the database: 
Fran - 2:00 (men), 2:07 (women)
Helen - 6:13, 7:20
Grace - 1:14, 1:17
Filthy 50 - 14:05, 16:13
FGB - 520, 460
400 meters - :44, :50
5,000 meters - 12:37, 14:11
Clean & Jerk - 263 KG, 190 KG
Snatch - 214 KG, 151 KG
Deadlift - 461 KG, 264 KG
Back squat (raw) - 450 KG, 280 KG
Max pull-ups - 106, 80

**There is a significant amount of selection bias in these self-reported numbers, which is why I used the bucketing approach to account for it. In general, the people reporting their numbers for each lift/run/metcon are better at those lifts/runs/metcons than those who leave them blank. Also, for many of the metcons, less experienced athletes may not even have a PR. As an example of this bias, if you take a straight average of the clean and jerk across all women under 40 finishing all 5 events, it's about 134 pounds. But if you group the field by the 5% buckets as I have, take the average in each bucket, then average across all buckets, you get an average of 126 pounds, which I believe is more representative of the "true" average.