Consider three athletes: Rich Froning, Matt Fraser and Brian Horwath. Brian Horwath? Yes, Brian Horwath. As of 6 p.m. ET, he had the highest score on a video submission in 15.1 (229), and he attacked this workout completely differently than Froning (224) and Fraser (219). Horwath clearly didn't have the barbell strength that Froning and Fraser did, as evidenced by his 255-lb. clean and jerk in 15.1a (still quite respectable, don't get me wrong). In fact, he did singles on his snatches throughout the workout, but he made up for this with blistering speed everywhere else.
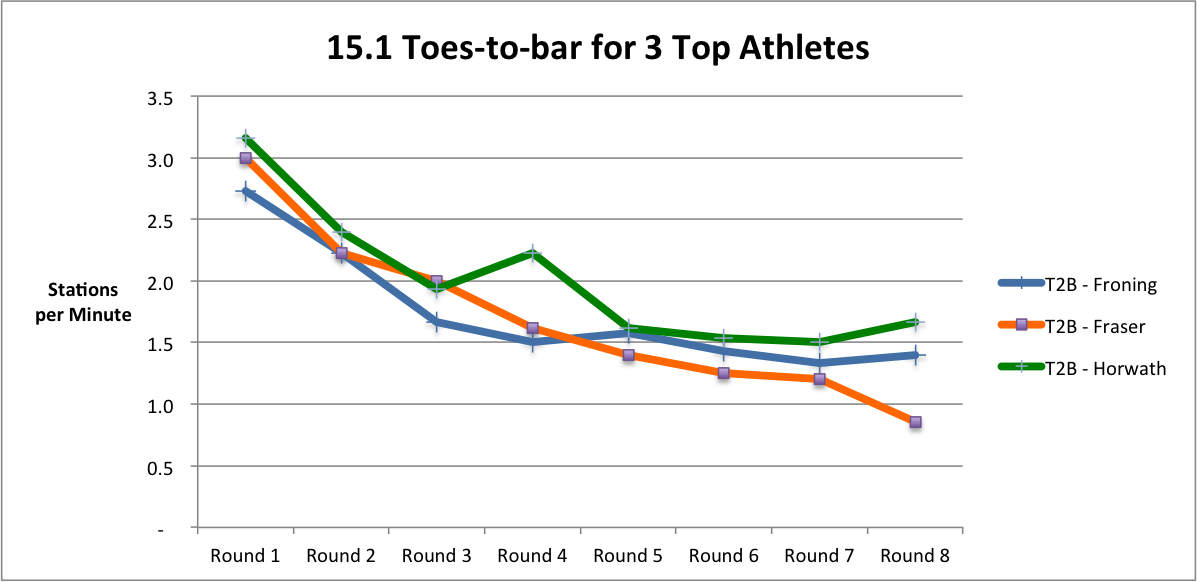
The three charts below show the pace of each athlete on each movement throughout the workout. Note a few things:
- The toes-to-bar degrade for all athletes here. There are few movements in CrossFit where this is as consistent as in the toes-to-bar. We saw it a few years ago in 13.4, and I see very few, if any, athletes who can consistently bang out sets of 10+ for a workout longer than 5 minutes.
- Horwath only goes a little faster than Froning and Fraser on the toes-to-bar, but he maintains that lead throughout. That small advantage was a big factor.
- Froning and particularly Fraser were much faster on the snatch. In the 10 or so videos I've watched, no one has come close to matching Fraser's speed on the snatch. In hindsight, maybe this was not the best strategy.
- Horwath blazed on the deadlift. Absolutely no rest whatsoever after getting off the pull-up bar. That saved him about 4-5 seconds per round on Fraser and Froning.


Remember, there are many ways to win a workout, and in the Open more than any other time, strategy matters.
[Update 3/7/2015 below]
I know we've all moved on to 15.2, but I finally was able to complete a reasonable analysis of how much each movement was valued on 15.1. I'll skip the deep background on this and instead refer you to this post and this post. Below are the results, based on a review of 9 elite-level male athletes (all scored at least 190 on 15.1 and hit at least 290 on 15.1a.)

The interpretation of this is that if an athlete goes 1 standard deviation slower than average on the toes-to-bar and 0.5 standard deviations faster than average on the other two movements, that athlete's score will be 7.4% worse than an athlete who is average on all three movements. In the deadlift column, this represents a scenario where the athlete is slower on deadlifts but a little faster on the other two movements. In the snatch column, this represents a scenario where the athlete is slower on snatches but a little faster on the other two movements.
What this is telling us is that athletes are punished most for a weakness on the toes-to-bar, followed by snatch, followed by deadlift. The spread here is pretty wide, and the deadlift showing a negative-3.7% leveraging is pretty amazing. If you're not very speedy on the deadlifts, it was not hard to make up for that on the other two movements. Conversely, if you struggle with toes-to-bar, you are in big trouble.
From the feedback I've received and seen online, this lines up very much with what people feel intuitively about the workout. The 7.4% leveraging (at 1 standard deviation) is actually slightly lower than the 7.8% leveraging I observed on 14.1 last year, but we all know that 14.1 was all about the snatch. And if we compare to what I saw when I looked at Jackie at the 2013 Regionals, the toes-to-bar in 15.1 was far more leveraged than any of those movements (in the original post I adjusted each movement by 2 standard deviations, but when I adjusted that to be 1 standard deviation, the highest leverage on any movement was the pull-ups for women at 2.2%).
Note that this type of analysis is quite time-consuming, so I don't do it that often. If split times became more easily obtainable, I'd like to do this on a more regular basis, as I find it quite fascinating and potentially useful for athletes.
Wondering if you had plans on doing an article on whether or not Grid athletes were still competing in the Open? I've noticed a couple names that haven't submitted a 15.1 score.
ReplyDeleteI hadn't planned to do anything, but that could be an interesting topic post-Open. Are there any big, big names you're thinking of?
DeleteI did see that one of the NPGL teams (Baltimore I think) had a combine this past Saturday. That seems like it has to be intentional to stick it right in the middle of the first week of the Open. I wonder if they really are trying to force the top athletes to make a decision between CF and NPGL now. That being said, the way it seems like the NPGL is trying to go, the ideal athletes might not be CrossFitters. It might be better to have a collection of specialists that all have at least modest conditioning.
Thier season kicks off in mid June this year so I'd have to think they're making steps toward forcing athletes choose between one or the other. The recent signing of Matt Frasor leads me to beleive it'll be possible to do both this year, but that day is coming pretty soon.
DeleteI might have jumped the gun saying that yesterday though because some of the names I saw yesterday have validated scores today. I still don't see Ruth Anderson Horrell, Shana Alverson, OPT or Sam Dancer with a score though, and that was just cherry picking about a dozen or so athletes who's names I knew on Grid teams last year.
Shana, OPT, and Sam aren't even registered. You can tell because the Region field is empty on their profile.
Deletehey,
ReplyDeletegreat post! one request: could you explain the charts' vertical axis?
thanks
Sure - the vertical axis represents "stations per minute," which is basically the inverse of how much time it took them to complete the station. So since Fraser completed his snatches in about 15 seconds most rounds, his stations per minute was around 60/15=4.0.
DeleteI always try to put things in terms of rates (stations per minute, reps per minute, etc.) instead of in terms of time to completion. It helps my comparisons to always be consistent, and my theory is that the rate of speed is much more of a "normal" variable than the time to completion. If you want more background on that I can point you to one of my older posts.
thanks that would be great!
DeleteHere are a few older pieces I've written that touch on this. I'd start with the first one, that will get you a good background I think. The second one has some similar charts to this article. The third and fourth are only if you really want to get into the weeds.
Deletehttp://cfganalysis.blogspot.com/2013/03/wod-design-and-why-it-usually-pays-to.html
http://cfganalysis.blogspot.com/2013/03/quick-hits-open-week-4-initial-thoughts.html
http://cfganalysis.blogspot.com/2012/11/if-were-going-to-stick-with-points-per.html
http://cfganalysis.blogspot.com/2012/08/opening-pandoras-box-do-we-need-new.html
thank you!
Delete