Follow me on Twitter!


Monday, March 11, 2013

How Few Points Do You Need to Make Regionals?

[Note: I goofed the first time I posted this (Monday afternoon), forgetting that 2011 had 6 events, not 5. The final results in this updated post are similar, but some of the methodology had to change. I'm on vacation, so I'm doing my best to post this revised version quickly despite a pretty slow internet connection.]

Today I’d like to take on a topic that may be irrelevant to 95% of the competitors, but which is of great consequence to the remaining 5%. Although we know exactly how well athletes overall must place in order to reach the regionals (ignoring for a moment the vagueness surrounding whether HQ will invite a few extra athletes in certain regions), we do not know exactly how well an athlete needs to do in each particular workout in order to finish well enough overall. In fact, we cannot know this for sure, no matter how much research we do and how robust a model we might use to predict it.

For the purposes of this post, let’s assume that an athlete needs to finish in the top 48 in his/her region to qualify for the regionals. To be sure, placing 48th or better in every workout would guarantee this (that’s 240 points). But given the nature of our sport, we know it’s not necessary to place that high in every event. Because of the way athletes’ performances vary between events, athletes finishing toward the top of the standings on each event will tend to finish higher than the average of their individual event placements. Conversely, athletes near the bottom will tend to finish lower than the average of their individual event placements. So for athletes near the top, the question is, just how far can you afford to fall in each event and still keep your hopes alive? I hate to be the bearer of bad news, but for about 80% of the athletes, their first event score alone will be too many points to qualify for regionals. That’s the nature of the points-per-place system: there are some holes you simply cannot dig yourself out of.
So how can we try to estimate the number of points necessary? Well, based on the data available, our best shot is to develop a model based on the number of competitors in each region to try to estimate the number of points you’ll need at the end of week 5. Without knowing any more about each region (are certain ones more top-heavy than others, for instance), this is really all we can base our estimate on. Let’s start by looking at what happened last year.

I went through each region’s 2012 results and recorded the following information: the point total of the 48th and 60th place athletes and the total number of competitors that competed in week 1. I did this separately for men and women. I’ll focus on the 48th place model for now but I’ll throw in some results for the 60th place model at the end, since it’s possible that HQ will end up taking athletes who finish that low. Below are scatter plots for both men and women, with the number of week 1 competitors on the x-axis and the 48th place points on the y-axis. (I apologize for the small charts. I'm posting this from a different computer and it's not letting me size the charts when I post them to the blog. Hopefully I can get them re-sized eventually.)

To me, the relationship looks roughly linear with an intercept near 300 or so. We know there is no way that the 48th place athlete can possibly score fewer than 240 points (mentioned earlier), even if there are only 60 or 70 athletes. From that point, however, the number of points needed rises as the field gets larger, and thus more competitive. We could simply slap a linear estimate on here and call it a day, but I think it might be a bit more complicated. I also decided to look at 2011 – would we see the same type of relationship there? Well, sort of. 

Below are scatter plots for the men in 2011 and 2012, each with their own linear fit on the graph to help illustrate the point. (Note: To get the 2011 points, I tried to get an estimate of what the points would have been after 5 weeks. Since I was a little strapped for time, I looked at the total points after 6 weeks and then scaled it back to about 75% of that number. That 75% figure was based on looking at a few regions and actually calculating out the rankings after 5 weeks. That would have been too time-consuming to do for every region, though.)


We can see that the intercept is lower for the 2011 group, but the slope of the line is steeper. It's tough to use 2011 to infer too much from these differences, however, because the region sizes were generally so much smaller in 2011.

So what do we do about predicting this year? Well, I decided to come up with three different models to provide a bit of a range. The first model is based solely off of 2012. This produces the "mid" estimate. Using all the data points from 2011 and 2012 produces a steeper line (the "high" estimate) that is higher for the larger groups but slightly lower for very small groups. The third model ("low" estimate) assumes that the slope of the line will continue to decrease in 2013, similarly to the way it did from 2011 to 2012. I repeated this process for the women as well.

Below is are the three men's models in graphical form.


For the men, the mean absolute error was 27 the 2012 model and 25 for the 2011-2012 combined model. For the women, the mean absolue error was 19 the 2012 model and 21 for the 2011-2012 combined model. Keep in mind those were the errors on the historical data; the tricky part here is estimating how well these models will translate to 2013.
 
There is no doubt that there is a bit of "fuzzy" math going on here due to the data limitations we're facing. But despite the difficulties in making these estimates, I think they do provide some insight into what types of scores you’ll need to make it to regionals. People tend to get concerned if they finish 100th or 150th in event 1, but realistically, in many larger regions you probably can still make it just by hitting those numbers each week. That being said, there’s no doubt I’d be sweating bullets those last few weeks if I was anywhere near the cutoff, so if you feel like you need to hit a workout two (or three) times, I won’t stand in your way.

Here are my final estimates. To use them, find the number of athletes in your region, then find that number (as closely as you can) on in the column on the left. For example, in my region, the Central East, we have about 4,800 men's athletes at the end of week 1, so my mid estimate is that 637 points (about 127 per week) will put you in 48th and 728 points (about 146 per week) will put you in 60th.


*Note: I think an interesting analysis for another day would be to look at the number of athletes in each region who actually impact the standings at the top. You could do this by removing each athlete from the competition and testing whether the point totals of the top 48 (or 60) athletes changed at all. This number of athletes would probably correlate much more strongly to the number of points needed to make regionals. However, a difficult task would be estimating this number for 2013 so we could make predictions. But it’s something to consider.

Friday, March 8, 2013

Quick Hits: Open Week 1 Initial Thoughts

This will just be a quick one, since we really don't have enough results in to draw a ton of conclusions, but I wanted to write up some thoughts on the first workout before I head out of town tomorrow morning. I've got a more detailed post planned looking at the number of points you'll likely need to score in order to make regionals. It's an interesting topic for sure, but for now, let's stick with Week 1.

So here we go, in no particular order:
  • I really like the programming here, especially as it compares to last year. Not that HQ was influenced in any way by my blog, but I'd like to quote my last post regarding WOD design: "For instance, something like AMRAP 10 of 10 snatches (95/65), 10 burpees will punish the specialist more so than AMRAP 7 of burpees followed by AMRAP 10 of snatches." Lo and behold, HQ actually puts up a workout that does punish the specialist more by setting up the workout this way. A little eerie, no? 
  • Thank you, HQ for implementing a tie-breaker. Although I'm sure there may be some bumps along the way with people inputting this incorrectly, the scoring is infinitely more fair to everyone involved. There is no more push to get that ONE REP that will make a 4,000-point difference. Also, the athletes who get that one or two snatches at the beginning of each new weight are now rewarded the way they should be, since all the athletes who tied just below them don't automatically get pushed up to the top end. 
  • Time will tell, but my feeling is that this workout punishes the "burpee-specialist" more than the "snatch-specialist." Most people can grind through the first 100 reps, but what will really separate a large majority of people will be that 30 snatches at 135/75. I'd like to do the type of leveraging analysis I talked about in my last post, but the varying weights on the snatch makes it a bit more complicated. Maybe we can do something with the results to look into this once they're complete.
  • As an athlete, I was surprised how much this workout hurt. I underestimated the "suck" factor of the burpees, and I'm not exactly sure why. Burpees are always terrible; I suppose that's the lesson here. For what it's worth, I got 154 reps (4 snatches at 165) and that will probably be my only attempt.
  • I'd be curious how HQ chose the weights for this. My guess was that when they set it up last year (12.2), they tried to base the weights on specific percentiles of the 1RM's that were listed. They are certainly out of line with the typical women's scaling (more reading on women's scaling in a prior post for those interested). It looks like we're seeing that for the top women, these weights are much easier than for the top men, which is consistent with what we saw last year. I could see someone like an Annie Thorisdottir or Lindsay Valenzuela hitting 20+ snatches at 120.
  • Now that the snatch and burpees have been combined, we're likely to see at least one more movement than we saw last year. My hope is that there are no single-modality workouts this year, because in my opinion, five workouts isn't enough to waste one of those on a single movement. Especially in light of how incredibly tight the competition is getting just to qualify for regionals, you need to test as many things as possible in order to select the best athletes.
As I noted above, my next post will look into how many points an athlete will likely need to reach regionals. Suffice it to say you don't need to be in the top 48 every week to finish there, but exactly how far you can fall in any given week is a tricky question to answer. Though it likely won't affect me,  a lot of athletes need to know what types of scores they can afford to post, and whether re-doing a workout (and wasting a training day) is a necessity.

Good luck to all the rest of week 1!

Sunday, March 3, 2013

WOD Design and Why It (Usually) Pays to be Well-Rounded

With the Open just a few short days away, I wanted to look at how the design of a CrossFit workout can affect the results we see in competition. I considered writing a last-minute manifesto on why HQ should not program 7 minutes of burpees for the first workout, but I've resigned myself the inevitability of that happening on Wednesday night, so let's just move on. (Reverse jinx right there? Maybe...)

It goes without saying that CrossFit is a sport that demands its athletes be strong in all areas of fitness. Any glaring weakness will eventually be exposed, and no one is winning the CrossFit Games (or even making it there) with a major deficiency in any area. That being said, simply because a movement comes up in a workout does not tell us exactly what type of emphasis is placed on it. In my earlier post "What to Expect From the 2013 Games and Beyond," I summarized all the movements used in the last two years of competition based on how much of the total score they represented. To do this, I assumed that in a workout with 3 movements, they were each worth 1/3 of the score. While this does give us a good idea of the value of each movement in aggregate, the truth is that it doesn't tell the whole story.

Consider two workouts, both comprised of thrusters and pull-ups. Workout A is 3 minutes of thrusters followed by 3 minutes of pull-ups, with the total number of reps as the score. Workout B is "Fran" (21-15-9 rounds of thrusters and pull-ups). Below are two charts showing how an athlete would fare given his/her rate of pull-ups per minute and his/her rate of thrusters per minute. The red cells represent better scores and the green cells represent poorer scores.


Look first at the top chart. You can see that the scores are identical along each diagonal, moving from top right to lower left. That's because you can exactly offset a deficiency in one movement with an equivalent improvement in the other one. Doing 30 pull-ups per minute and 20 thrusters per minute produces the same score as 25 per minute of each.

Now look at the chart for Fran. In this case, the best scores always occur when the athlete is balanced. Performing 25 thrusters per minute and 25 pull-ups per minute produces a time of 3.6 minutes (~3:36). Improving the pull-ups to 30 per minute but decreasing the thrusters to 20 per minute produces a time of 3.8 (~3:48). The reason for the discrepancy involves some pretty simple algebra.

In a workout where a certain number of reps has to be performed at each station, the time needed to finish a station is (reps needed) / (reps per minute). If we improve our speed by 20%, that lowers the time for that station to (1 / 1.2) = .83 times the original time. If we decrease our speed by 20%, it increases the time for that station by (1 / 0.8) = 1.25 times the original time. In total, our new time is ((.83 + 1.25) / 2) = 1.04 times the original time. So you can see the punishment for a poor movement is greater than the reward for a strong movement. In a workout where there is a fixed time domain per station, we don't have this effect.

One way to quantify this effect is to look at the drop in performance in a workout that occurs when we drop the speed of one movement by 20% and increase the other movement(s) by a total of 20%. So if there are three movements, we drop one by 20% and increase the other two by 10%. 

I'll also need to make some assumptions are necessary about the "base" speed for each movement. "Fran" was an easy example above because it's reasonable to assume that on average, thrusters and pull-ups take a similar amount of time for most athletes. That isn't necessarily the case with other workouts. My estimates for these base speeds for each movement are roughly based on my own results, but I also was trying to represent a relationship between the movements that is pretty typical for CrossFitters. But I will admit, there are no exact answers for this. Changing these assumptions based on the level of athlete will certainly change our answers, and I'll go more into that in a moment.

Let's look at a few workouts from the Open in years past. A few notes first: 
  • The result for each movement is what I'm calling "leverage." It represents the decrease in performance if we drop the speed of a given movement 20% and increase the others by 20% (in total).
  • I'm using a using a 20% decrease for each movement, but that's just an arbitrary choice. Any other choice (10%, 30%, 40%, etc.) would yield slightly different results, but the concept is the same. 
  • The term "Rate" here means the speed, in terms of stations per minute (it's just the inverse of the minutes per station, which I listed first because it's easier to comprehend).
  • I calculated the score as the number of stations, not the total number of reps. That's because all reps are not equal: one double-unders doesn't mean as much as one muscle-ups. All stations aren't necessarily equal, either, but it's better than simply counting reps.

OK, onto the results.


WOD 12.3 is pretty much a classic CrossFit workout. For most athletes, all three movements take a similar amount of time, although I think it's fair to say the push jerks were generally the slowest, especially as the workout wore on. You see that each movement is leveraged a decent amount, but athletes who struggled on push jerks were punished the most.


For WOD 11.1, based on the assumptions I've used, the snatch was the more critical movement, despite being the second of two movements. For athletes who have solid double-unders, they will almost certainly be slower on the snatches. This means that a deficiency on the snatch is really exposed, whereas the double-unders weren't punished too much, so long as the athlete didn't have a catastrophic weakness.


WOD 12.4 was an interesting case. The wall balls took up a big chunk of time for all athletes, while the double-unders should be comparatively quick for athletes who are pretty competent with them. For most athletes, the muscle-ups are going to be slow, especially at that point of the workout. But what is also key here is that the order of movements is critical. Athletes who struggle with wall balls will be punished hard, and they may not even make it to the double-unders or muscle-ups, hence we see the 7.5% leveraging factor. Conversely, the double-unders and muscle-ups were actually negatively leveraged, meaning this athlete would actually benefit if he/she got 20% slower at that movement but 10% faster at each of the other two. I'm sure that shorter athletes who may excel at muscle-ups but struggle with wall balls can probably relate to this fact.

Now let's look at 12.4 once more, but for an elite athlete who is gunning for about 1 full round.


You can see that for the elite athlete, the muscle-ups become much more important, while the wall balls aren't quite as critical as for the intermediate athlete. Still, though, slightly slower double-unders were not a problem if you could offset that deficiency with strengths elsewhere.

Now, I tend to prefer workouts like 12.3, where the stations have relatively similar time domains and no single movement can make or break the workout. However, I believe there are reasons for designing workouts where certain movements are leveraged significantly more than others. For one, since the Open is designed to be inclusive, the workouts will almost always start with the movement that is easier to complete for one rep. This allows the maximum number of athletes to compete. I'd be stunned if we ever see a workout in the Open start with muscle-ups.

Another issue is that certain movements are prone to have a wider range of speeds than others. For instance, wall balls are basically capped around 30-35 reps/minute due to gravity, so it takes more reps for athletes to really separate themselves. With something like muscle-ups, however, a set of 20 muscle-ups can separate even the best athletes in the world by quite a bit. So perhaps it makes more sense to design the workout so that the wall ball stations take twice as long as the muscle-up station. I notice this a lot with rowing: if you're not careful, the row can become a throwaway movement (as far as competition is concerned) unless you devote a considerable portion of the workout to that movement. The difference between a strong and weak rower just isn't that wide, even over something like 1,000 meters that takes more than 3 minutes.

So what can we take away from this? Well, personally, I learned a few things in doing this analysis, or at least put some numbers behind some things I (and likely others) sensed intuitively:

1) You can't offset any weakness by simply being stronger in another area. In general, it pays to shore up weaknesses across the board rather than improving in areas you are already strong.

2) This concept varies depending on the workout. In some cases, you can actually benefit from being particularly great in one area and weaker in others. Sometimes this means the workout isn't perfectly designed. However, it could be because HQ is programming the workout to account for the fact that certain movements take more time/reps to separate athletes than others.

3) Order matters in an AMRAP. We saw this clearly in WOD 12.4. And although I didn't show it as an example above, the thuster/pull-up ladder (WOD 11.6 & 12.5) also is a great example. For athletes with a base speed of 15 reps/minute on each movement (105 reps for the workout), the thrusters are leveraged at 5.7% and the pull-ups are leveraged at just 1.4%.

4) Testing movements together, with a required number of reps on each movement, will punish weaknesses more than testing them separately. For instance, something like AMRAP 10 of 10 snatches (95/65), 10 burpees will punish the specialist more so than AMRAP 7 of burpees followed by AMRAP 10 of snatches. (Sorry, I know I promised not to argue against the 7 minutes of burpees, but I couldn't resist...)

So these are some intriguing conclusions, but what can we do with this moving forward? Well, there are two ways I can see this type of analysis being applied moving forward:

1) Once a workout is released, athletes can start to understand what the keys to the workout will be. If we plug in some assumptions for a certain level of athlete, we can see how much each movement is leveraged based on the workout design. That might provide some insight on how to attack a workout. For 12.4, we can see that the hitting the gas on the wall balls might be worthwhile, even if the double-unders suffer a bit. Again, this may have been intuitive to many athletes/coaches, but seeing some numbers can help to clarify things.

2) We can assess what worked and didn't work in programming a competition. In theory, you could actually look back and calculate how long it took (on average) for athletes to complete each movement, and then use that information to get a clear picture of how much each movement truly was leveraged. Did you adequately test the movements you wanted to? Was the workout balanced? If not, was that by design? Just because a workout seemed friggin' awesome when you wrote it up doesn't mean it actually turned out to be a great test of fitness.


Anyway, that's all for today. Time permitting, I'm hoping to post something each week during the Open. No guarantees on exactly what those posts will look like or what type of analysis I'll be doing, other than to say I'll be talking about the Open. So pop on over this way from time-to-time during the week - it's got to be a healthier habit than leaderboarding. 

Sunday, January 27, 2013

Upcoming Blog Schedule

Just wanted to give a quick update on my schedule for the next few months. Due to work and studying requirements over the next five weeks, I do not plan to post any new entries until the Open begins (for any other actuaries or actuarial students out there, I'll be taking the Interim Assessment starting in a few days). After that, I plan to post fairly regularly throughout the Open and continuing through the Games season. Ideally, I'd like to have at least one post per week throughout the Open as new workouts are released and new results roll in. Like many of you, I'll be competing as well, so it should be an exciting, busy and hopefully not too stressful time.

Until then, good luck to all with your training. And if Tony Budding is reading this, I think I speak for all (or at least most) of us when I say we better not see 7 minutes of burpees again this year...

Monday, December 10, 2012

Quick Hits: Women's Scaling and The Outlaw Open

In stark contrast to my last post, I just wanted to touch on a few topics briefly today without getting too involved. These were just a couple of interesting topics that I got into this past weekend.


Women's Scaling:

CrossFit HQ has asserted in the past that there are no "prescribed" women's scaling options for their workouts. According to HQ, each workout should be scaled to the particular athlete's abilities. I'm not going to argue with that sentiment here, at least as it applies to training. But the fact is that HQ does scale the weights differently for men and women during competitions, and most, if not all, local CrossFit competitions do the same. But are they scaled fairly?

Counting the Outlaw Open (Dec. 1-2), I've now analyzed seven different competitions from the past two years (the other six are the Open, Regionals and Games from 2011-2012). What I wanted to look at now was the average relative weight on metcons and the load-based emphasis on lifting (LBEL) in each competition for both men and women. What I found was this:

For metcons, the average relative weight for women has been between 61-71% of the men's load. In total, the LBEL (which includes all events) has been between 61-69%. That's not a huge spread, but it could mean the difference between programming cleans at 95 lbs. and 110 lbs.

To see if there was an "optimal" relativity between men's and women's weights for CrossFit competitions, I decided to look into the (few) non-metcon lifting events we've had in those competitions. In those seven competitions, there have been three max snatches, two max cleans, one max thruster, one max bench and one 5-rep max deadlift. Taking the average of the field in each of those events, the women's results were between 51-65% of the men's. The 51% was on the bench at the Outlaw Open - my theory on the bench being so much lower is that a lot of emphasis is placed on the bench in many men's sports, including football (just a theory though). Other than bench, all others were between 58-65%. Considering that the average female competitor at the 2012 Games weighed a shade under 75% of the average male competitor, I'd say those are some damn impressive strength numbers.

If those maxes are a decent indication - and I think they are - then the programming should generally be looking to keep the women's weights at around 60-62% of the men's. And in fact, things appear to be moving toward that. In 2011, the women's loads in the Open, Regionals and Games were between 66-71% of the men's (using either LBEL or average metcon weight); in 2012, they were between 61% and 68%. At the Outlaw Open, the LBEL was 62% of the men's and the average metcon load was 65%.

This all assumes that the goal is to make the women's events just as challenging for their field as the men's events are to their field. For the most part, bodyweight movements are not scaled at all for women, which helps explains why in the 2012 Games, the average women's time on metcons was still about 20% slower than the men's. But perhaps that's not a problem. I think a lot of the draw for women's competition is seeing these women doing virtually the same thing as the fittest men in the world. I'd venture to say the top women are about as proficient at muscle-ups as the top men were just 3 or 4 years ago, if not more proficient. And at the Outlaw Open, the average max-rep set of pull-ups (after two miles of running and a 5-rep max deadlift) for the women was 33, just 9 behind the men.


Outlaw Open Notes:

The Outlaw Open is the first non-HQ sponsored competition that I've analyzed, so I thought it would be interesting to see how it compared to the Open, Regionals and Games, and also, what we can learn about the athletes who competed there (and there were some heavy hitters).

First, this won't come as much of a shock, but the Outlaw Open was heavy. Real heavy. The average relative weight on metcons for the men's competition was a 1.45*, which is 23% higher than the highest we've seen in the Games or Regionals. To give you a feel of what a 1.45 means, these are the types of weights you'd see in an average metcon:

Clean/Jerk - 195
Snatch - 145
Deadlift - 350
Thruster - 160
Overhead squat - 165
Back squat - 275
Front squat - 232 (we actually saw 250 in a metcon here)

The average weight for the women's competition was 0.95, which is higher than the average load in the men's Open in 2011. You may want to read that last sentence again to let it sink in.

In terms of LBEL, which takes into account max-effort events as well as the portion of the competition that was weighted/unweighted, the men's Outlaw Open came in at 0.94. That's just a shade below the 2012 Regionals, the highest in an HQ competition. The LBEL gives a better indication of whether a competition "favors" bigger athletes, so the inclusion of more bodyweight movements (in total the split was 50/50 between bodyweight and lifts) helped to balance things out. It's interesting to note that the men's CrossFit Invitational had an LBEL of 1.20, although that was a team competition so it's not exactly an apples-to-apples comparison.

As far as the types of movements involved*, here's how the Outlaw Open stacked up against the Open, Regionals and Games the past two years.


This kind of blew my mind that an Outlaw competition actually included Olympic lifts as a relatively modest portion of the scoring (I did take into account the points available on each event). So while the weight levels may have been most similar to the Regionals, the types of movements were distributed much more like the Games.

So what can we learn from the Outlaw Open? Well, clearly given the level of competition, anyone finishing well has to come away feeling good about their preparations for the upcoming season. I tend to think this will be most predictive of performance at the Regional level (vs. the Open or the Games), although we didn't see any lighter, higher-rep, grinding metcons, and the Regionals have had one of those the past two years. But if the Regionals are once again heavy, I think you'll see the top athletes from this competition with a good shot to get to the Games. Did someone say "vindication for Matt Hathcock?" We shall see...


*Assumptions on base weights for non-standard movements:
Wheelbarrow - 240 (same as deadlift)
Double KB thruster - 44 each arm (assumes DB's are 2.25x as difficult as a barbell, and KB's are 1.1x as difficult as a DB)
Double KB snatch - 40 each arm (same assumption)
Barbell step-up - 95 (this one was purely a judgement call based on watching the athletes a bit)
I'm always looking for more data to refine these base weights, so let me know if you have reason to believe these are out of line.

**If you've read my last post, you'll see that that I now have eliminated "Medicine Ball Lifts." I moved wall-balls into KB/DB lifts (I felt they are most similar to a DB thruster) and moved all other movements involving a medicine ball/slam ball (medicine ball cleans, ball slam, GHD ball toss, etc.) to "Uncommon Crossfit Movements."


Wednesday, November 28, 2012

Does Our Training Look Like What We're Training For? Should It?

OK, well I think it's time to try and tackle one of the most complex subjects in the sport of CrossFit: training. About two months ago, I posted an analysis of the past two Games seasons, looking at what types of movements we've seen, the relative weights we've seen, and what we're likely to see this season. I think there was good insight to be gained from that piece, but I did not intend it to be interpreted as an instruction on how we should be training. I was simply looking into what it is CrossFit HQ is testing.

But the natural follow-up question is this: If performing well in the Open is our goal, should our training look like the Open as well? If performing well at Regionals is our goal, should our training look like what we'll see at Regionals?

I'm going to try and approach this in two parts. First, I want to look at this from a mathematical, somewhat theoretical perspective to see what we can learn that way. Next, I want to examine some popular and successful training regimens and see how they compare to the Open, Regionals and Games.


Part 1: A Theoretical Perspective

(If you absolutely hate algebra, I apologize in advance. This section contains some, but there's pretty much no way to understand the theoretical angle without it. Skip ahead to Part 2 if you must.)

Sometimes it's important to understand what we do not know. As I started working on this piece, my thought was that yes, for the most part, our training should look like what we are training for. If the Open is going to be 30% Olympic lifting, for example, then we should basically spend about 30% of our training energy on Olympic lifting, right? But as I started to think about this, I had a Lee Corso moment: "Not so fast, my friends."

Let's imagine a scenario where there are only two types of movements in the world: running and bench press (the Arnold Pump-and-Run world). If the competition we are training for features 70% bench press and 30% running, how should we split our training to maximize our performance? We will assume all events are scored separately and added together for a total score, so in our preparation, we want to improve our score as much as possible. In other words, we want to maximize this equation:

Improvement in Score = 0.70 * (improvement in bench press) + 0.30 * (improvement in running)

Now, let's assume at first that each hour spent training bench press can improve our bench press an equal amount. And we'll assume that each hour spent training running improves our running by this same amount. Let's now assume that we have exactly 5 hours per week to train, and each hour can score us 10 additional points in the events related to we are training for (keep in mind that the points in the running events are worth only 30% of total points but points in the bench press are worth 70% of total points). If this is the case, what should our training look like? Well, what we have now are two equations that define our improvement in bench press and running as a function of time spent. The way I have defined these, the graphs would look like a straight diagonal line angling up as you move to the right, and the equation for each would be:

Improvement in bench press = 10 * (hours spent bench pressing)
Improvement in running = 10 * (hours spent running)

Rewriting the second equation because we have a finite amount of time to train:

Improvement in running = 10 * (5 - hours spent bench pressing)

Now we can plug our two equations for the improvement into our original equation and try to maximize it. The equation we get is:

Improvement in Score = 0.70 * (10 * (hours spent bench pressing)) + 0.30 * (10 * (5 - hours spent bench pressing)) = (4 * hour spent bench pressing) + 15

I'll spare you the calculus, but the end result is that we would actually want to spend all of our time bench pressing if this were the case. Sure we wouldn't be "well-rounded," but we'd score the most possible points in the competition. Here's a chart illustrating our total improvement each week as a function of time spent bench pressing:


The maximum is all the way at the right side of the chart, meaning devoting all 5 hours to bench press. So clearly, if every moment of training were equal, what we would want to do is focus on the aspect of training that is emphasized more in competition. But in real life, every moment of training is not equal. What we see is diminishing returns, meaning that (in general), the value of each additional moment of training a particular movement declines the more we train that movemen. For instance, if you train your bench press 1 hour per week for 10 weeks, you may be able to bench press 15 more lbs. than you did at the start. But if you increase that to 2 hours per week, you may be able to bench press only 25 more lbs. than you did at the start. At 3 hours per week, you might be at 30 more lbs. Another way to phrase this is that the marginal effectiveness of an additional hour of bench pressing is declining.

In this case, our decision becomes more complicated. Depending on how quickly the marginal effectiveness declines for each movement, the graph of our improvement as a function of time spent bench pressing could look like one of these three curves (or plenty of others):


In these cases, the optimal time spent bench pressing (the pinnacle of each curve) could in fact be 50%, 70% or 80%. In general, the more quickly the returns diminish on each exercise, the closer you'll want to be to an even split between movements. But to my knowledge, we do not yet know what these functions are in reality (and they almost certainly vary depending on the skill level already attained). So even in this incredibly simplified scenario with just two movements, it is impossible to say with any certainty how much time one should spend on each exercise in training.

My feeling is that there are three key things we would need to know in order to determine the "perfect" balance between movements in your training program: 1) the scoring emphasis for each different movement (we do know this to some extent); 2) the amount of improvement to be gained on each movement, as a function of time spent on the movement (this can and probably will vary by movement); 3) the amount of "carryover" from one movement to the others (meaning that training the Olympic lifts might also improve the Powerlifting-style movements, or vice versa). There are some additional considerations with our sport, because you do have to have a minimum level of skill in every area, or else other areas can basically be rendered useless. If someone struggles mightily with toes-to-bar, their performance on 12.3 would be terrible even if they could push press 300 lbs. Still, I believe that, theoretically, we could also optimize these splits, as well as the splits between time domains and relative weight levels in a similar fashion. Potentially, careful research could eventually shed some light onto the second and third items, but at the current time, the best we can do is make educated guesses about them.

So while it seems like we may have learned nothing from this, we have indeed learned something: even if we know exactly what we are training for, we do not yet know the perfect way to train for it. To be sure, understanding what we are training for helps. The more Olympic lifting we are tested on, the more we should train it. But how much more? We (or at least I) just don't know for sure yet.


Part 2: How We Are Training

So we don't know the perfect way to train yet. That doesn't mean that some methods are not preferable to others. Some athletes have made great strides from year to year while others stagnated. There are coaches out there working extremely hard to understand the optimal ways to train, and we can learn from them. I'd like to look at the training for a few well-known CrossFit programs and see how they compare to the Open, which is what the vast majority of serious CrossFit athletes are training for (yes, there are maybe a couple hundred who can safely look past the Open to the regionals, but when guys like Rob Orlando are barely qualifying for regionals these days, overlooking the Open is a dangerous move for most).

Now, I understand that there are other great coaches and great programs out there besides the ones I am examining. Please do not skewer me if I have omitted your favorite. This work is time-consuming, and I do not mean to imply that these are the best programs by any means. They are just a few that I have followed to some extent in the past.

First, let's look at what it is we're training for. This is all based on the analysis from my prior post on what to expect from the Open, but I've grouped the movements into eight categories. A couple notes: 1) "Olympic-style Barbell Lifts" includes things like thrusters, overhead squats and front squats, which either help develop the Olympic lifts or have similar movement patterns and explosiveness (e.g., thruster); 2) "Pure Conditioning" includes running, rowing and double-unders; 3) "Uncommon CrossFit Movements" includes stuff that isn't on the main site often, like sled pushes, monkey bars or the sledgehammer. For a full list of what I've included in each, see the bottom of this post.


Additionally, here are a couple other metrics to help us understand the the load and duration of these workouts. I did not include the time calculations last time. For workouts that are not AMRAP, I have made rough estimates based on the average finisher (all max-effort workouts are in the 5:00 or under category, even if it was a ladder that spanned 8-10 minutes). Please see my last post on what to expect in the Open for more detail on how the others were calculated.


Again, let's mainly focus on the Open. That's what the vast majority of athletes are training for at the moment. Now let's see how these popular training programs compare. 

First, some notes on how I handled the tricky parts of this analysis. For the purpose of this analysis, I have assumed that all strength or skill work that is performed in addition to a metcon is worth 0.5 "events." All metcons and all standalone strength workouts are worth 1.0 "events." The goal of this was to weight each part of the training program by how much mental and physical energy they took to complete, and for me, some strength work before a metcon does not tax me the same way the actual metcon does (or a standalone, main site-style strength WOD).

For strength workouts, I basically assumed that a max-effort lift was a 2.0 relative weight. If a percentage of the the max was used, it was multiplied by the 2.0. For strength workouts with a set number of reps, I assumed that doubles were at roughly 95%, triples at 90%, sets of 4 at 85% and sets of 5 at 80%. Beyond that, it was sort of a judgement call. Workouts calling for percent of bodyweight (like Linda) assumed a 185-lb. person.

Now, for our first program, we will start where it all started: the main site (CrossFit.com). I'm not sure if any top athletes rely primarily on the main site these days, but it's still very popular for plenty of other athletes. I don't even know if Tony Budding or Dave Castro or whoever programs the main site would say that maximizing performance in the Open is even a goal of their programming. Regardless, we'll examine it. 

The main site was the first program that I began tracking for this project, and it's also the easiest to track, because of the one workout per day set-up. I have used the past 6 weeks of workouts for this analysis.

The second program is CrossFit New England. I followed CFNE for some time and still sprinkle in workouts from their site in my own training pretty regularly. CFNE is not vastly different from the main site in its set-up, although they do program a decent amount of strength and skill work alongside the metcons. Note that this is not Ben Bergeron's CompetitorsWOD, and so this is probably tailored to a more general audience. I have used the past 3 weeks of workouts for this analysis.

The third program I looked at is The Outlaw Way. I have followed The Outlaw Way a bit, and coach Rudy Nielsen has produced plenty of Games-level athletes in the past few years. In my estimation, this program is the most competitor-focused of the ones we'll look at it today. And it was, without a doubt, the hardest of the programs to analyze. Rudy almost always programs one or two pieces of strength/skill work before the metcon, and so my assumption that these are worth 0.5 "events" is a significant one here. Still, I think we can gain some insight by trying our best to quantify what The Outlaw Way is doing. I have used just over 2 weeks of workouts for this analysis (sorry, but tracking these workouts is time-consuming - there were as many total movements used in 2 weeks as there were in almost 5 weeks of the main site!).

Finally, selfishly, I have thrown in my own training. I began this experiment by tracking my own training, and so since I already have the data ready to go, why not throw it in here, right? For what it's worth, I finished about 200th in my region (Central East) last year and am shooting to qualify for Regionals this year, although I know that's going to be tough. I train 3-on-1-off for about 60-75 minutes at a time. I have used the past 6 weeks of workouts for this analysis.

Let's see how these training programs compare to the Open.


As mentioned above, there is a good deal of judgement involved in compiling this data. Let's not read too much into small differences between programs and try to focus on the big picture. Here are some of my observations:

Going Heavy: All four training programs had a higher LBEL than the Open, and Outlaw was heavier by a wide margin (heavier even than the regionals). The difference seemed to come from the added strength work, because the actual metcons themselves weren't much different than the Open, besides Outlaw again.

Powerlifting: Although we don't actually see many Powerlifting-style movements in competition (back squat, deadlift, press, bench press), we do see it a lot in training. I recall a video where Tony Budding said that max efforts on slow lifts like the deadlift may not be appropriate for competition, but they are useful in training. This seems to be the case - across all competitions, they made up just about 4% of the points, but we're seeing 7-12% of emphasis in these programs.

Couplets and Triplets: We've heard it on the main site before that couplets and triplets (not longer chippers) should make up the bulk of your training, and it seems to be the case for these programs. It is interesting, however, that the main site averages significantly more movements per metcon that CFNE or Outlaw, neither of whom programmed chippers often. Prior work I've done ("Are Certain Events 'Better' Than Other") indicated that chippers were more predictive of overall fitness in competition, so I suppose the theory in training is that each of the movements gets "watered down" too much in a chipper. I'd be curious to know if there is solid evidence to back up this philosophy, although I tend to agree with it. UPDATE: Actually my previous post indicated that workouts with more movements tended to be more predictive of overall fitness, not necessarily that chippers were better than triplets or couplets. In fact, the "best" event through Open and Regionals was 12.3, a triplet.

Surprisingly Similar Balance Across Programs: I was surprised to see that each program generally put the emphasis on the same types of movements. Sure, the main site was a bit lighter on the Olympic lifting and heavier on the basic gymnastics, but in general, things weren't too different. Also note that none of the programs leaned as heavily on the Olympic lifts and basic gymnastics as the Open. Although...

Outlaw Lifts A Lot: One thing that doesn't show up on the comparison above is the total volume of training; it only deals with how the training time is divided. But it's worth pointing out that Outlaw's training goes through many more movements in a typical day than any of the others, and many of them are Olympic lifts. Below is a chart of the at a pure count of how many times the snatch, clean and jerk appeared, regardless of how much it was emphasized within the workout and allowing for multiple appearances in a day.


Keep in mind that the metcons at Outlaw are generally pretty short and the reps per set are generally low in the strength work, so the overall volume is not quite as intense as it may appear. And again, this is only two weeks worth of data. Also, CFNE's stats are a little inflated because they post a workout 7 days a week, and it's doubtful that many athletes are following the program completely without any rest.

Note that I didn't try to compute the time domains for the training programs. This is primarily because it was just too hard. I haven't completed all these workouts and I don't have readily available data (aside from combing through all the comments on each site) to figure out the time domains if it's not an AMRAP or a strength workout. But I can say that Outlaw is virtually entirely under the 12:00 domain, and the other three seem to be in relatively the same proportion as the Open.

In my opinion, this analysis is really just a starting point for trying to understand training from a statistical angle. The data points aren't nice and clean, and admittedly there are some pretty critical assumptions involved that can have a big impact on the analysis (I've tried my best to note them along the way). This was not simple and it was not easy.

In no way is programming the only factor in an athlete's success. Diet, technique, intensity and desire are all keys. Still, I believe there is value in continuing to evaluate how we're training and thinking critically about why we're training that way.


Note: I'd be very interested in trying to get some information on the training program for athletes (of all skill levels) who competed in last year's Open and plan to compete this year. We can talk theory all we want and look into some successful programs, but good data would really help to understand what types of training really do bring results. Please email me at anders@alumni.wfu.edu if you have any interest in helping me out. I would not be reporting on any individual's or any gym's training or results in the Open, but simply using information about the training program and improvements from 2012 to 2013. Based on the response, I'll try to gauge whether this is feasible this year.


*Finally, here's a chart showing what movements were included in each subcategory. This is not necessarily an exhaustive list, becaues it only includes movements that appeared in one of the four training programs in my analysis:


Sunday, November 18, 2012

If We're Going to Stick With Points-per-Place, A Suggestion

After the positive response in the past few days to my post about what to expect from the next Games season, I'd like to continue to write more about training for the upcoming season. I don't purport to be an expert trainer, and I'm certainly not going to be prescribing any workouts, but I hope I can provide a different perspective on the Games and get some discussion started on programming for training vs. competition. But, alas, my schedule this past week just did not give me the time to get into that topic in full detail yet.

Today, I've just got a follow-up on my earlier post regarding the CrossFit Games scoring system ("Opening Pandora's Box: Do We Need a New Scoring System"). In fact, this is actually a follow-up to a comment to that post.

Tony Budding of CrossFit HQ was kind enough to stop by and respond to my article, in particular my suggestion that we move to a standard deviation scoring system. You can read my post and Tony's comment in full to get the details, but the long and short of it is this: HQ is sticking with the points-per-place system for the time being. I'd like to keep the discussion going in the future about possibly moving away from this system, but for now, I accept that the points-per-place is here to stay. Tony made some good points, and I understand the rationale, though I stand by my argument.

Anyway... Tony mentioned that they are still working on ways to refine the system. Certain flaws, like the logjams that occurred at certain scores (like a score of 60 on WOD 12.2) are probably fixable with different programming, and there are some tweaks that could be made to address other concerns (for instance, only allowing scores from athletes who compete in all workouts). But I had another thought that would allow us to stick with the points-per-place system while gaining some of the advantages of a standard deviation system.

At the Games for the past two years, the points-per-place has been modified to award points in descending order based on place, with the high score winning (in contrast to the open and regionals, where the actual ranking is added up and the low score wins). In addition, the Games scoring system has wider gaps between places toward the top of the leaderboard. In my opinion, this is an improvement over the traditional points-per-place system because it gives more weight to the elite performances. However, I think we can do a little better.

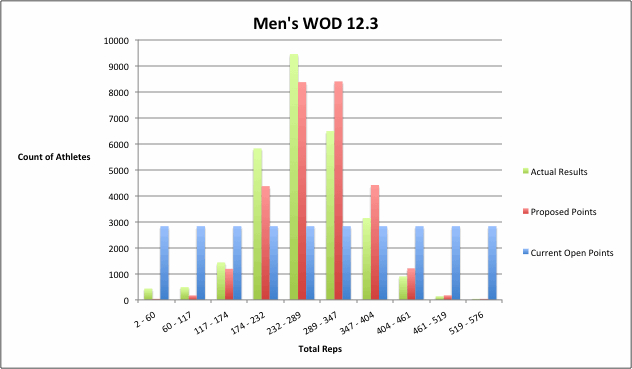
First, here is my rationale for why we should have wider gaps between the top places. If you look at how the actual results of most workouts are distributed, you'll see the performance gaps are indeed wider at the top end. The graph below is a histogram of results from Men's Open WOD 12.3 last year:


There are fewer athletes at the top end than there are in the middle, so it makes sense to reward each successive place with a wider point gap. However, the same thing occurs on the low end, with the scores being more and more spread out. But the current Games scoring table does not reflect this - the gaps get smaller and smaller the further down the leaderboard you go (the current Open scoring system obviously has equal gaps throughout the entire leaderboard).

Now, another issue with the current Games scoring table is that it's set up to handle only one size of competition (the maximum it could handle is around 60). So let's try to set up a scoring table that will address my concern about the distribution of scores but can be used for a comeptition of any size (even the Open).

Obviously, the pure points-per-place system used in the Open will work on a competition of any size, but what is essentially does is assume we have a uniform distribution of scores. Basically, the point spread between any two places is the same regardless of where you fall in the spectrum. So what happens is the point difference between 100 burpees and 105 burpees becomes much wider than the gap between 50 and 55 or 140 and 145. So my suggestion is this: let's use a scoring table that ranges from 0-100 but reflects a normal (bell-shaped) distribution rather than a uniform (flat) distribution. The graph below shows that same histogram of WOD 12.3 (green), along with a histogram of my suggested scores (red) and a histogram of the current open points (blue). The scale is different on each histogram, but there are 10 even intervals for each, so you can focus on how the shapes line up.


You can see that the points awarded with the proposed system are much more closely aligned with the actual performances than the current system. And this was done without using the actual performances themselves - I just assumed the distribution of performances was normal and awarded points, based on rank, to fit the assumed distribution.

Now, you may be asking, how well does this distribution fare when we limit the field to only the elite athletes? Well, the shape does not tend to match up as well as we saw in the graph above. Part of this is due to the field simply being smaller, so there is naturally more opportunity for variance from the expected distribution. However, for almost every event in last year's Games, there is no question that the normal distribution is a better fit than the current Games scoring table. The chart below shows a histogram the actual results from the men's Track Triplet along with the distribution of scores using the proposed scoring table and the current scoring table. I have displayed the distribution of scores from the scoring table with lines rather than bars to make the various shapes easier to discern.


As stated above, we do not perfectly match the actual distribution of results. But clearly the actual results are better modeled with the normal distribution than with the current scoring table. As further evidence, the R-squared between the actual results and the proposed scoring table is 96.0%; the R-squared between the actual results and the current scoring table is only 83.9%. If we make this same comparison for each of the first 10 events for men and women (excluding the obstacle course, which was a bracket-style tournament), the R-squared was higher with the proposed scoring table than with the current table, with the exception of the women's Medball-HSPU workout.

I believe this proposed system, while not radically different than our current system, would be an improvement but would not have any of the same issues that concerned HQ about the standard deviation system. While the math used to set up the scoring system may be difficult for many to digest, that's all done behind the scenes and the resulting table is no more difficult to understand than the current Games scoring table, especially if we round all scores to the nearest whole number. If used in the Open, we'd almost certainly have to go out to a couple decimal places, but I think otherwise this system would work fine. And since we are still basing the scores on the placement and not the actual performance, this system also does not allow, as Tony said, "outliers in a single event [to] benefit tremendously." It does, however, reward performances at the top end (and punish performances at the low end) more than the current system.

I appreciate the fact that Tony took the time to review my prior work, and I hope that he and HQ will consider what I've proposed here.


*Below is the actual table (with rounding) that would be used in a field of 45 people (men's Games this year), compared with the current system.


**MATH NOTE: In case you were wondering, here is the actual formula I used in Excel to generate the table: 

POINTS = normsinv(1 - (placement / total athletes) + (0.5 / total athletes)) * (50 / normsinv(1 - (0.5 / total athletes)) + 50

This first part gives us the expected number of standard deviations from the mean, given the athlete's rank. Next we multiply that by 50 and divide by the expected number of standard deviations from the mean for the winner (this will give the winner 50 points and last place -50 points). Then we add 50 to make our scale go from 0-100.